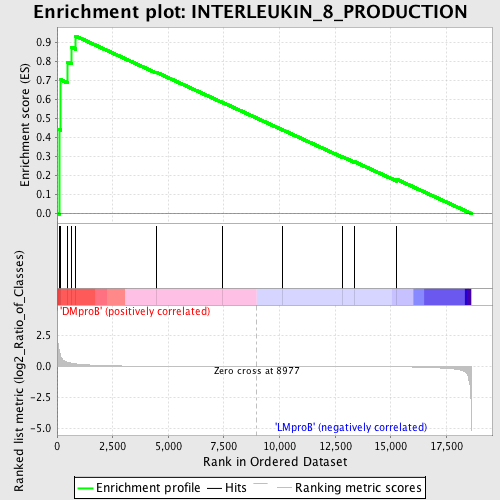
Profile of the Running ES Score & Positions of GeneSet Members on the Rank Ordered List
| Dataset | Set_04_DMproB_versus_LMproB.phenotype_DMproB_versus_LMproB.cls #DMproB_versus_LMproB |
| Phenotype | phenotype_DMproB_versus_LMproB.cls#DMproB_versus_LMproB |
| Upregulated in class | DMproB |
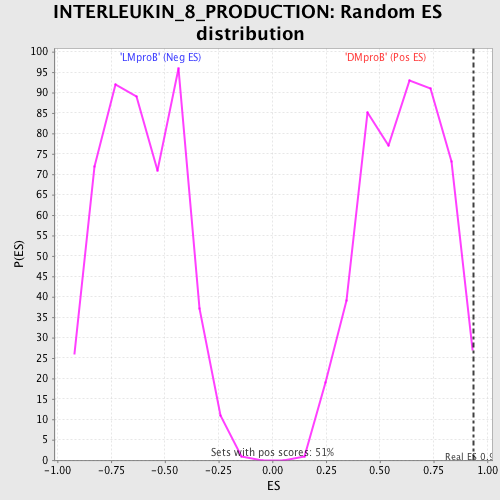
| GeneSet | INTERLEUKIN_8_PRODUCTION |
| Enrichment Score (ES) | 0.9340192 |
| Normalized Enrichment Score (NES) | 1.5254526 |
| Nominal p-value | 0.00990099 |
| FDR q-value | 0.55229574 |
| FWER p-Value | 1.0 |
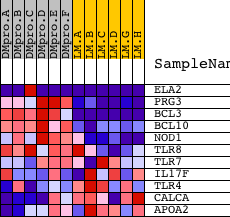
| PROBE | DESCRIPTION (from dataset) | GENE SYMBOL | GENE_TITLE | RANK IN GENE LIST | RANK METRIC SCORE | RUNNING ES | CORE ENRICHMENT | |
|---|---|---|---|---|---|---|---|---|
| 1 | ELA2 | 11925 8893 | 90 | 1.325 | 0.4424 | Yes | ||
| 2 | PRG3 | 14971 | 166 | 0.787 | 0.7041 | Yes | ||
| 3 | BCL3 | 8654 | 478 | 0.324 | 0.7969 | Yes | ||
| 4 | BCL10 | 15397 | 634 | 0.260 | 0.8764 | Yes | ||
| 5 | NOD1 | 17141 | 839 | 0.203 | 0.9340 | Yes | ||
| 6 | TLR8 | 9308 | 4450 | 0.013 | 0.7443 | No | ||
| 7 | TLR7 | 24004 | 7411 | 0.003 | 0.5862 | No | ||
| 8 | IL17F | 13992 | 10135 | -0.002 | 0.4404 | No | ||
| 9 | TLR4 | 2329 10191 5770 | 12826 | -0.008 | 0.2986 | No | ||
| 10 | CALCA | 4470 | 13383 | -0.010 | 0.2721 | No | ||
| 11 | APOA2 | 8615 4044 | 15265 | -0.027 | 0.1801 | No |