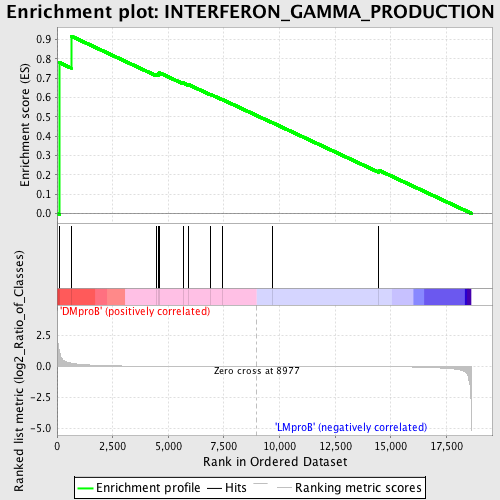
Profile of the Running ES Score & Positions of GeneSet Members on the Rank Ordered List
| Dataset | Set_04_DMproB_versus_LMproB.phenotype_DMproB_versus_LMproB.cls #DMproB_versus_LMproB |
| Phenotype | phenotype_DMproB_versus_LMproB.cls#DMproB_versus_LMproB |
| Upregulated in class | DMproB |
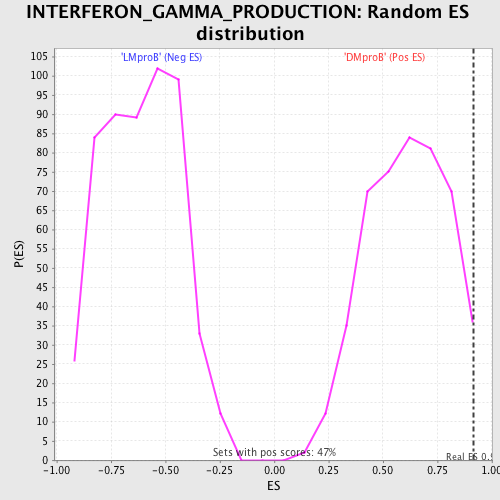
| GeneSet | INTERFERON_GAMMA_PRODUCTION |
| Enrichment Score (ES) | 0.9182506 |
| Normalized Enrichment Score (NES) | 1.5009633 |
| Nominal p-value | 0.023655914 |
| FDR q-value | 0.6855289 |
| FWER p-Value | 1.0 |
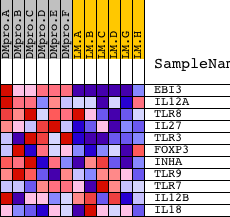
| PROBE | DESCRIPTION (from dataset) | GENE SYMBOL | GENE_TITLE | RANK IN GENE LIST | RANK METRIC SCORE | RUNNING ES | CORE ENRICHMENT | |
|---|---|---|---|---|---|---|---|---|
| 1 | EBI3 | 23193 | 109 | 1.238 | 0.7807 | Yes | ||
| 2 | IL12A | 4913 | 632 | 0.261 | 0.9183 | Yes | ||
| 3 | TLR8 | 9308 | 4450 | 0.013 | 0.7212 | No | ||
| 4 | IL27 | 17636 | 4558 | 0.012 | 0.7231 | No | ||
| 5 | TLR3 | 18884 | 4608 | 0.012 | 0.7279 | No | ||
| 6 | FOXP3 | 9804 5426 | 5660 | 0.007 | 0.6760 | No | ||
| 7 | INHA | 14214 | 5901 | 0.007 | 0.6673 | No | ||
| 8 | TLR9 | 19331 3127 | 6906 | 0.004 | 0.6158 | No | ||
| 9 | TLR7 | 24004 | 7411 | 0.003 | 0.5905 | No | ||
| 10 | IL12B | 20918 | 9681 | -0.001 | 0.4693 | No | ||
| 11 | IL18 | 9172 | 14467 | -0.017 | 0.2230 | No |