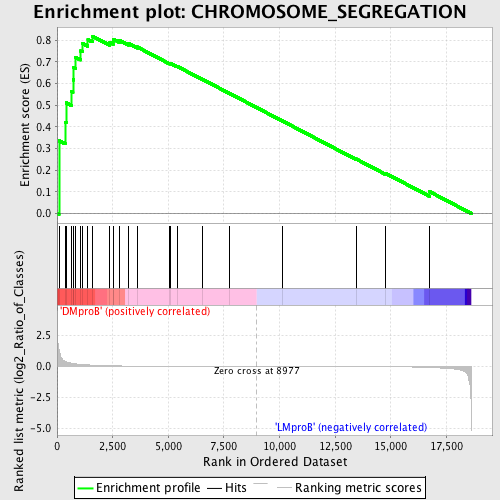
Profile of the Running ES Score & Positions of GeneSet Members on the Rank Ordered List
| Dataset | Set_04_DMproB_versus_LMproB.phenotype_DMproB_versus_LMproB.cls #DMproB_versus_LMproB |
| Phenotype | phenotype_DMproB_versus_LMproB.cls#DMproB_versus_LMproB |
| Upregulated in class | DMproB |
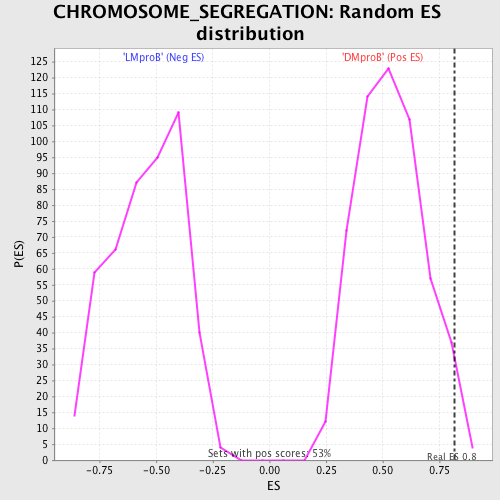
| GeneSet | CHROMOSOME_SEGREGATION |
| Enrichment Score (ES) | 0.8189306 |
| Normalized Enrichment Score (NES) | 1.5361527 |
| Nominal p-value | 0.015209125 |
| FDR q-value | 0.48933068 |
| FWER p-Value | 0.999 |
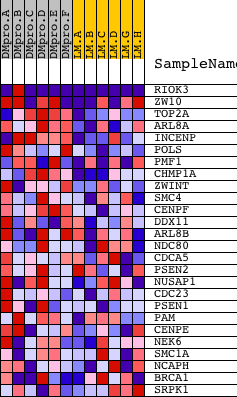
| PROBE | DESCRIPTION (from dataset) | GENE SYMBOL | GENE_TITLE | RANK IN GENE LIST | RANK METRIC SCORE | RUNNING ES | CORE ENRICHMENT | |
|---|---|---|---|---|---|---|---|---|
| 1 | RIOK3 | 7354 12425 1973 | 86 | 1.344 | 0.3365 | Yes | ||
| 2 | ZW10 | 3114 19464 | 365 | 0.392 | 0.4210 | Yes | ||
| 3 | TOP2A | 20257 | 410 | 0.365 | 0.5112 | Yes | ||
| 4 | ARL8A | 14120 | 657 | 0.251 | 0.5616 | Yes | ||
| 5 | INCENP | 23748 | 715 | 0.234 | 0.6179 | Yes | ||
| 6 | POLS | 9963 | 749 | 0.224 | 0.6730 | Yes | ||
| 7 | PMF1 | 12452 | 827 | 0.207 | 0.7212 | Yes | ||
| 8 | CHMP1A | 10634 | 1062 | 0.165 | 0.7505 | Yes | ||
| 9 | ZWINT | 19992 | 1145 | 0.154 | 0.7850 | Yes | ||
| 10 | SMC4 | 15568 | 1386 | 0.122 | 0.8031 | Yes | ||
| 11 | CENPF | 13723 | 1580 | 0.103 | 0.8189 | Yes | ||
| 12 | DDX11 | 23169 | 2369 | 0.053 | 0.7900 | No | ||
| 13 | ARL8B | 7396 | 2519 | 0.046 | 0.7937 | No | ||
| 14 | NDC80 | 22900 | 2531 | 0.046 | 0.8048 | No | ||
| 15 | CDCA5 | 23788 | 2800 | 0.036 | 0.7996 | No | ||
| 16 | PSEN2 | 13736 | 3211 | 0.027 | 0.7844 | No | ||
| 17 | NUSAP1 | 2956 4250 | 3597 | 0.021 | 0.7690 | No | ||
| 18 | CDC23 | 6985 | 5064 | 0.010 | 0.6926 | No | ||
| 19 | PSEN1 | 5297 2125 9630 | 5110 | 0.009 | 0.6925 | No | ||
| 20 | PAM | 5222 | 5391 | 0.008 | 0.6795 | No | ||
| 21 | CENPE | 15414 | 6544 | 0.005 | 0.6188 | No | ||
| 22 | NEK6 | 15018 | 7739 | 0.002 | 0.5551 | No | ||
| 23 | SMC1A | 2572 24225 6279 10780 | 10142 | -0.002 | 0.4264 | No | ||
| 24 | NCAPH | 14444 | 13439 | -0.010 | 0.2517 | No | ||
| 25 | BRCA1 | 20213 | 14751 | -0.020 | 0.1862 | No | ||
| 26 | SRPK1 | 23049 | 16740 | -0.085 | 0.1009 | No |