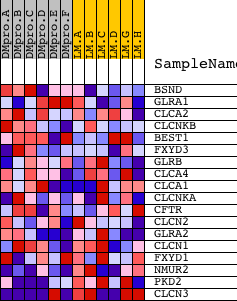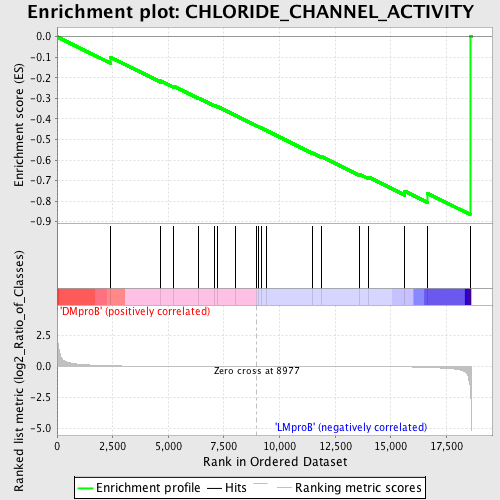
Profile of the Running ES Score & Positions of GeneSet Members on the Rank Ordered List
| Dataset | Set_04_DMproB_versus_LMproB.phenotype_DMproB_versus_LMproB.cls #DMproB_versus_LMproB |
| Phenotype | phenotype_DMproB_versus_LMproB.cls#DMproB_versus_LMproB |
| Upregulated in class | LMproB |
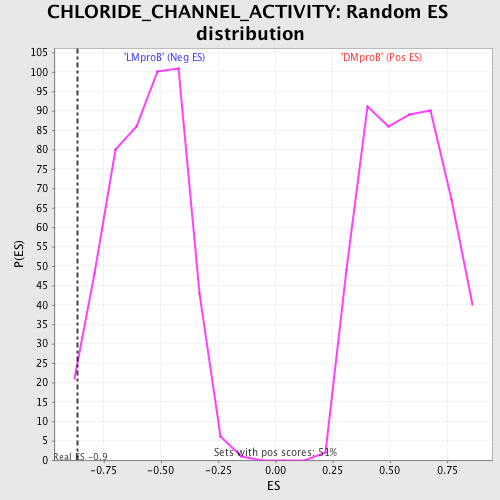
| GeneSet | CHLORIDE_CHANNEL_ACTIVITY |
| Enrichment Score (ES) | -0.86510175 |
| Normalized Enrichment Score (NES) | -1.5350302 |
| Nominal p-value | 0.010288066 |
| FDR q-value | 0.87903744 |
| FWER p-Value | 1.0 |
| PROBE | DESCRIPTION (from dataset) | GENE SYMBOL | GENE_TITLE | RANK IN GENE LIST | RANK METRIC SCORE | RUNNING ES | CORE ENRICHMENT | |
|---|---|---|---|---|---|---|---|---|
| 1 | BSND | 15821 | 2408 | 0.051 | -0.1006 | No | ||
| 2 | GLRA1 | 9021 | 4657 | 0.011 | -0.2150 | No | ||
| 3 | CLCA2 | 15148 | 5248 | 0.009 | -0.2418 | No | ||
| 4 | CLCNKB | 7105 | 6360 | 0.005 | -0.2986 | No | ||
| 5 | BEST1 | 23747 | 7073 | 0.004 | -0.3349 | No | ||
| 6 | FXYD3 | 9370 | 7212 | 0.003 | -0.3404 | No | ||
| 7 | GLRB | 15312 1846 | 8026 | 0.002 | -0.3832 | No | ||
| 8 | CLCA4 | 6041 | 8953 | 0.000 | -0.4330 | No | ||
| 9 | CLCA1 | 15149 | 9039 | -0.000 | -0.4375 | No | ||
| 10 | CLCNKA | 15690 | 9164 | -0.000 | -0.4439 | No | ||
| 11 | CFTR | 17518 | 9422 | -0.001 | -0.4573 | No | ||
| 12 | CLCN2 | 22637 | 11483 | -0.004 | -0.5655 | No | ||
| 13 | GLRA2 | 24008 | 11891 | -0.005 | -0.5843 | No | ||
| 14 | CLCN1 | 8744 | 13599 | -0.011 | -0.6698 | No | ||
| 15 | FXYD1 | 17874 85 | 14006 | -0.014 | -0.6839 | No | ||
| 16 | NMUR2 | 20443 | 15624 | -0.035 | -0.7510 | No | ||
| 17 | PKD2 | 16772 | 16641 | -0.077 | -0.7619 | Yes | ||
| 18 | CLCN3 | 8745 3782 3893 4524 | 18562 | -1.534 | 0.0029 | Yes |