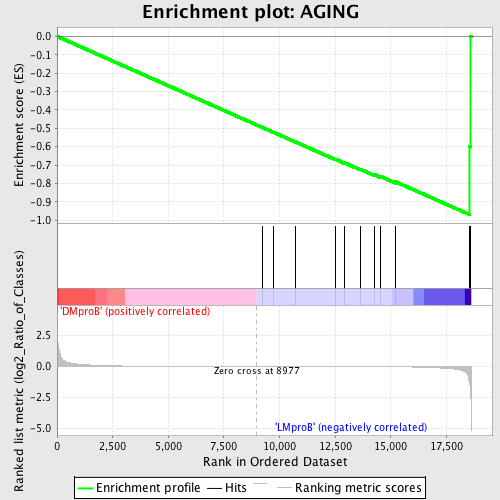
Profile of the Running ES Score & Positions of GeneSet Members on the Rank Ordered List
| Dataset | Set_04_DMproB_versus_LMproB.phenotype_DMproB_versus_LMproB.cls #DMproB_versus_LMproB |
| Phenotype | phenotype_DMproB_versus_LMproB.cls#DMproB_versus_LMproB |
| Upregulated in class | LMproB |
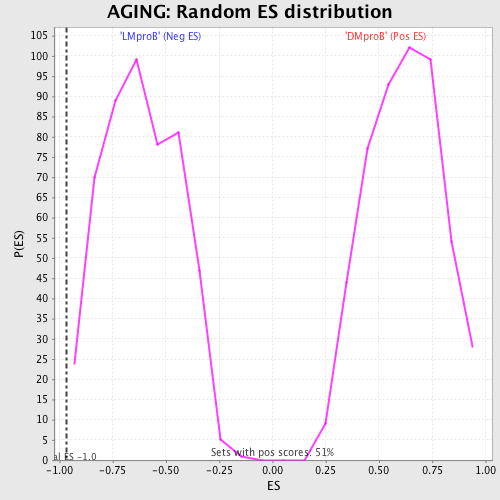
| GeneSet | AGING |
| Enrichment Score (ES) | -0.96922433 |
| Normalized Enrichment Score (NES) | -1.5724573 |
| Nominal p-value | 0.0020242915 |
| FDR q-value | 0.8493162 |
| FWER p-Value | 0.994 |
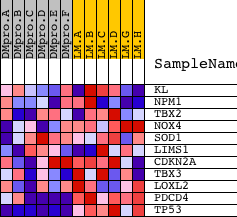
| PROBE | DESCRIPTION (from dataset) | GENE SYMBOL | GENE_TITLE | RANK IN GENE LIST | RANK METRIC SCORE | RUNNING ES | CORE ENRICHMENT | |
|---|---|---|---|---|---|---|---|---|
| 1 | KL | 16611 | 9220 | -0.000 | -0.4954 | No | ||
| 2 | NPM1 | 1196 | 9720 | -0.001 | -0.5219 | No | ||
| 3 | TBX2 | 20720 | 10719 | -0.003 | -0.5747 | No | ||
| 4 | NOX4 | 18196 | 12517 | -0.007 | -0.6692 | No | ||
| 5 | SOD1 | 9846 | 12914 | -0.008 | -0.6881 | No | ||
| 6 | LIMS1 | 8493 4290 | 13625 | -0.011 | -0.7230 | No | ||
| 7 | CDKN2A | 2491 15841 | 14281 | -0.016 | -0.7537 | No | ||
| 8 | TBX3 | 16723 | 14556 | -0.018 | -0.7633 | No | ||
| 9 | LOXL2 | 8256 | 15206 | -0.026 | -0.7906 | Yes | ||
| 10 | PDCD4 | 5232 23816 | 18530 | -1.281 | -0.5988 | Yes | ||
| 11 | TP53 | 20822 | 18592 | -2.086 | 0.0013 | Yes |