Profile of the Running ES Score & Positions of GeneSet Members on the Rank Ordered List
| Dataset | Set_04_DMproB_versus_LMproB.phenotype_DMproB_versus_LMproB.cls #DMproB_versus_LMproB |
| Phenotype | phenotype_DMproB_versus_LMproB.cls#DMproB_versus_LMproB |
| Upregulated in class | LMproB |
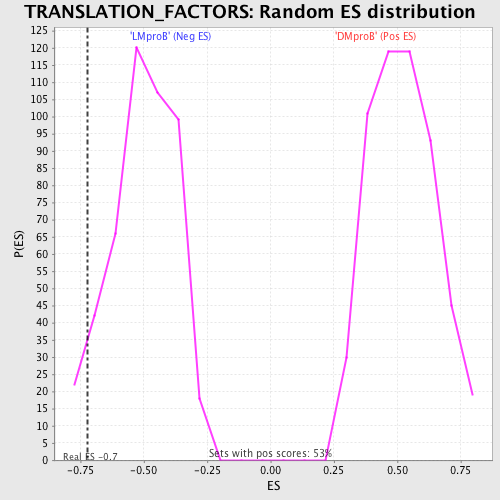
| GeneSet | TRANSLATION_FACTORS |
| Enrichment Score (ES) | -0.72048193 |
| Normalized Enrichment Score (NES) | -1.4367336 |
| Nominal p-value | 0.052742615 |
| FDR q-value | 0.7523538 |
| FWER p-Value | 1.0 |
| PROBE | DESCRIPTION (from dataset) | GENE SYMBOL | GENE_TITLE | RANK IN GENE LIST | RANK METRIC SCORE | RUNNING ES | CORE ENRICHMENT | |
|---|---|---|---|---|---|---|---|---|
| 1 | EEF1D | 12393 2309 | 143 | 0.967 | 0.0691 | No | ||
| 2 | EIF4G3 | 10517 | 771 | 0.217 | 0.0525 | No | ||
| 3 | EIF2AK3 | 17421 | 795 | 0.213 | 0.0682 | No | ||
| 4 | EIF3S4 | 6588 11988 | 910 | 0.190 | 0.0771 | No | ||
| 5 | EIF4G1 | 22818 | 1424 | 0.118 | 0.0589 | No | ||
| 6 | EIF4EBP2 | 4662 | 1929 | 0.077 | 0.0379 | No | ||
| 7 | SLC35A4 | 12588 | 1954 | 0.076 | 0.0426 | No | ||
| 8 | EIF4A1 | 8889 23719 | 2529 | 0.046 | 0.0154 | No | ||
| 9 | EIF2AK1 | 4869 | 4665 | 0.011 | -0.0986 | No | ||
| 10 | EIF1AY | 2643 24219 | 4749 | 0.011 | -0.1022 | No | ||
| 11 | EEF1A2 | 8880 14309 | 5297 | 0.009 | -0.1310 | No | ||
| 12 | GSPT2 | 4806 | 7024 | 0.004 | -0.2236 | No | ||
| 13 | EIF2S1 | 4658 | 9487 | -0.001 | -0.3561 | No | ||
| 14 | EIF5B | 10391 5963 | 10350 | -0.002 | -0.4024 | No | ||
| 15 | EIF3S9 | 16643 3528 | 12169 | -0.006 | -0.4998 | No | ||
| 16 | EIF4EBP1 | 8891 4661 | 12336 | -0.007 | -0.5082 | No | ||
| 17 | EIF4E | 15403 1827 8890 | 12516 | -0.007 | -0.5172 | No | ||
| 18 | EIF3S1 | 905 8114 | 14591 | -0.018 | -0.6275 | No | ||
| 19 | EIF3S3 | 12652 | 15000 | -0.023 | -0.6476 | No | ||
| 20 | EIF2B2 | 21204 | 15363 | -0.029 | -0.6648 | No | ||
| 21 | EEF2K | 18101 | 16385 | -0.064 | -0.7147 | Yes | ||
| 22 | EIF2B5 | 1719 22822 | 16415 | -0.065 | -0.7111 | Yes | ||
| 23 | EIF2B4 | 16574 | 16495 | -0.069 | -0.7099 | Yes | ||
| 24 | ITGB4BP | 9191 | 16506 | -0.070 | -0.7049 | Yes | ||
| 25 | EIF2B3 | 16118 | 16581 | -0.074 | -0.7030 | Yes | ||
| 26 | EIF2B1 | 16368 3458 | 16906 | -0.097 | -0.7128 | Yes | ||
| 27 | EIF3S5 | 18131 | 16928 | -0.098 | -0.7062 | Yes | ||
| 28 | EEF1G | 12480 | 17026 | -0.106 | -0.7030 | Yes | ||
| 29 | EIF2AK2 | 22892 | 17261 | -0.129 | -0.7053 | Yes | ||
| 30 | PAIP1 | 21556 | 17510 | -0.155 | -0.7063 | Yes | ||
| 31 | EIF3S6 | 4924 | 17551 | -0.161 | -0.6956 | Yes | ||
| 32 | EIF3S2 | 15744 2342 2478 | 17633 | -0.172 | -0.6863 | Yes | ||
| 33 | ETF1 | 23467 | 17650 | -0.174 | -0.6734 | Yes | ||
| 34 | EIF3S7 | 22226 | 17721 | -0.183 | -0.6626 | Yes | ||
| 35 | EIF3S8 | 7099 12100 | 17855 | -0.204 | -0.6536 | Yes | ||
| 36 | EEF1B2 | 4131 12063 | 17949 | -0.226 | -0.6407 | Yes | ||
| 37 | EIF2S2 | 7406 14383 | 18005 | -0.240 | -0.6246 | Yes | ||
| 38 | EIF5 | 5736 | 18081 | -0.267 | -0.6074 | Yes | ||
| 39 | EEF2 | 8881 4654 8882 | 18189 | -0.311 | -0.5884 | Yes | ||
| 40 | EIF5A | 11345 20379 6590 | 18409 | -0.534 | -0.5578 | Yes | ||
| 41 | EIF4A2 | 4660 1679 1645 | 18549 | -1.405 | -0.4537 | Yes | ||
| 42 | EIF3S10 | 4659 8887 | 18555 | -1.432 | -0.3402 | Yes | ||
| 43 | PABPC1 | 5219 9522 9523 23572 | 18613 | -4.324 | 0.0002 | Yes |