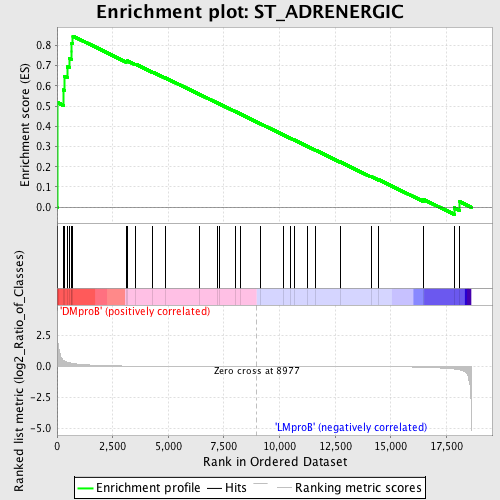
Profile of the Running ES Score & Positions of GeneSet Members on the Rank Ordered List
| Dataset | Set_04_DMproB_versus_LMproB.phenotype_DMproB_versus_LMproB.cls #DMproB_versus_LMproB |
| Phenotype | phenotype_DMproB_versus_LMproB.cls#DMproB_versus_LMproB |
| Upregulated in class | DMproB |
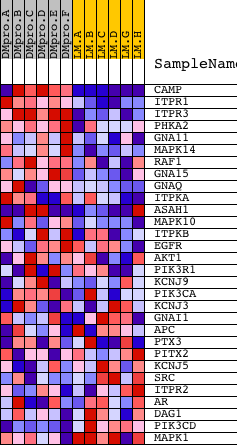
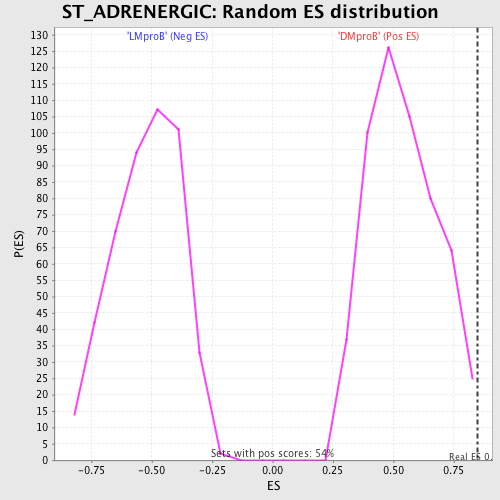
| GeneSet | ST_ADRENERGIC |
| Enrichment Score (ES) | 0.8463153 |
| Normalized Enrichment Score (NES) | 1.5642614 |
| Nominal p-value | 0.005586592 |
| FDR q-value | 0.5057153 |
| FWER p-Value | 0.874 |
| PROBE | DESCRIPTION (from dataset) | GENE SYMBOL | GENE_TITLE | RANK IN GENE LIST | RANK METRIC SCORE | RUNNING ES | CORE ENRICHMENT | |
|---|---|---|---|---|---|---|---|---|
| 1 | CAMP | 18990 | 8 | 3.213 | 0.5186 | Yes | ||
| 2 | ITPR1 | 17341 | 293 | 0.475 | 0.5802 | Yes | ||
| 3 | ITPR3 | 9195 | 334 | 0.424 | 0.6465 | Yes | ||
| 4 | PHKA2 | 8471 24216 | 455 | 0.336 | 0.6944 | Yes | ||
| 5 | GNA11 | 3300 3345 19670 | 547 | 0.290 | 0.7364 | Yes | ||
| 6 | MAPK14 | 23313 | 659 | 0.251 | 0.7709 | Yes | ||
| 7 | RAF1 | 17035 | 660 | 0.250 | 0.8112 | Yes | ||
| 8 | GNA15 | 19671 | 712 | 0.234 | 0.8463 | Yes | ||
| 9 | GNAQ | 4786 23909 3685 | 3100 | 0.029 | 0.7226 | No | ||
| 10 | ITPKA | 14898 | 3146 | 0.029 | 0.7248 | No | ||
| 11 | ASAH1 | 3835 3853 8630 | 3530 | 0.022 | 0.7078 | No | ||
| 12 | MAPK10 | 11169 | 4304 | 0.014 | 0.6684 | No | ||
| 13 | ITPKB | 3963 14028 | 4853 | 0.010 | 0.6406 | No | ||
| 14 | EGFR | 1329 20944 | 6418 | 0.005 | 0.5572 | No | ||
| 15 | AKT1 | 8568 | 7187 | 0.003 | 0.5165 | No | ||
| 16 | PIK3R1 | 3170 | 7286 | 0.003 | 0.5117 | No | ||
| 17 | KCNJ9 | 9210 | 8008 | 0.002 | 0.4732 | No | ||
| 18 | PIK3CA | 9562 | 8243 | 0.001 | 0.4608 | No | ||
| 19 | KCNJ3 | 4944 | 9162 | -0.000 | 0.4115 | No | ||
| 20 | GNAI1 | 9024 | 10178 | -0.002 | 0.3572 | No | ||
| 21 | APC | 4396 2022 | 10508 | -0.003 | 0.3399 | No | ||
| 22 | PTX3 | 9668 15575 | 10647 | -0.003 | 0.3329 | No | ||
| 23 | PITX2 | 15424 1878 | 11271 | -0.004 | 0.3001 | No | ||
| 24 | KCNJ5 | 9209 | 11630 | -0.005 | 0.2816 | No | ||
| 25 | SRC | 5507 | 12717 | -0.008 | 0.2244 | No | ||
| 26 | ITPR2 | 9194 | 14110 | -0.014 | 0.1518 | No | ||
| 27 | AR | 24286 | 14451 | -0.017 | 0.1362 | No | ||
| 28 | DAG1 | 18996 8837 | 16459 | -0.067 | 0.0391 | No | ||
| 29 | PIK3CD | 9563 | 17856 | -0.204 | -0.0031 | No | ||
| 30 | MAPK1 | 1642 11167 | 18096 | -0.272 | 0.0280 | No |