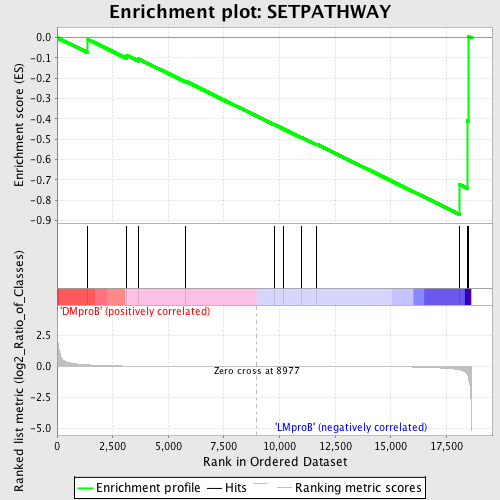
Profile of the Running ES Score & Positions of GeneSet Members on the Rank Ordered List
| Dataset | Set_04_DMproB_versus_LMproB.phenotype_DMproB_versus_LMproB.cls #DMproB_versus_LMproB |
| Phenotype | phenotype_DMproB_versus_LMproB.cls#DMproB_versus_LMproB |
| Upregulated in class | LMproB |
| GeneSet | SETPATHWAY |
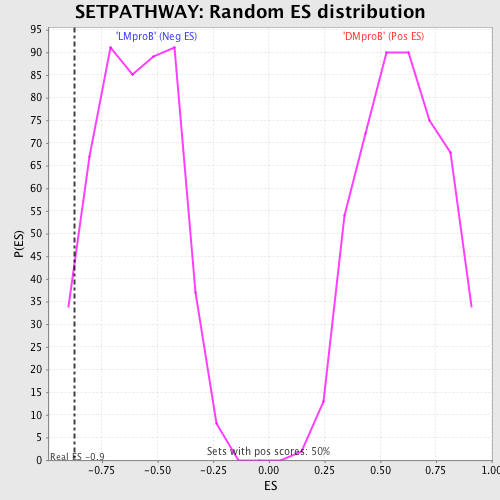
| Enrichment Score (ES) | -0.870761 |
| Normalized Enrichment Score (NES) | -1.4596003 |
| Nominal p-value | 0.0498008 |
| FDR q-value | 0.8519781 |
| FWER p-Value | 1.0 |
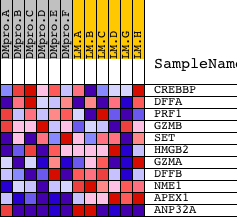
| PROBE | DESCRIPTION (from dataset) | GENE SYMBOL | GENE_TITLE | RANK IN GENE LIST | RANK METRIC SCORE | RUNNING ES | CORE ENRICHMENT | |
|---|---|---|---|---|---|---|---|---|
| 1 | CREBBP | 22682 8783 | 1385 | 0.122 | -0.0089 | No | ||
| 2 | DFFA | 4627 | 3134 | 0.029 | -0.0874 | No | ||
| 3 | PRF1 | 20011 | 3657 | 0.020 | -0.1047 | No | ||
| 4 | GZMB | 21810 | 5774 | 0.007 | -0.2147 | No | ||
| 5 | SET | 7070 | 9773 | -0.001 | -0.4289 | No | ||
| 6 | HMGB2 | 13594 | 10162 | -0.002 | -0.4487 | No | ||
| 7 | GZMA | 21343 | 10966 | -0.003 | -0.4901 | No | ||
| 8 | DFFB | 15654 | 11654 | -0.005 | -0.5244 | No | ||
| 9 | NME1 | 9467 | 18100 | -0.274 | -0.7235 | Yes | ||
| 10 | APEX1 | 22028 | 18437 | -0.619 | -0.4093 | Yes | ||
| 11 | ANP32A | 8592 4387 19415 | 18474 | -0.781 | 0.0076 | Yes |