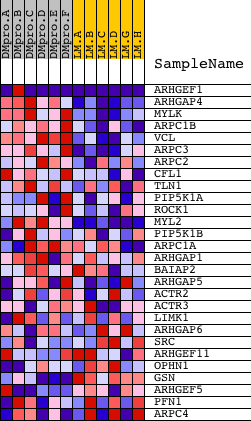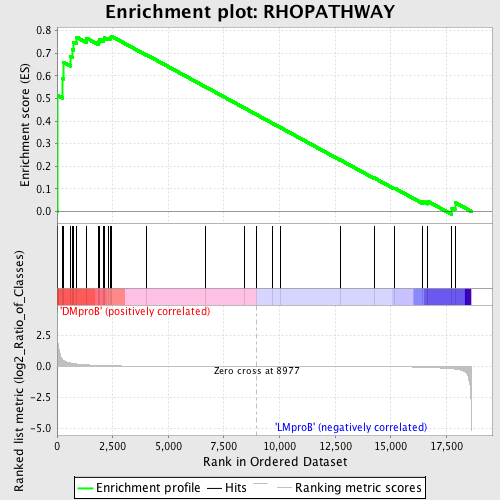
Profile of the Running ES Score & Positions of GeneSet Members on the Rank Ordered List
| Dataset | Set_04_DMproB_versus_LMproB.phenotype_DMproB_versus_LMproB.cls #DMproB_versus_LMproB |
| Phenotype | phenotype_DMproB_versus_LMproB.cls#DMproB_versus_LMproB |
| Upregulated in class | DMproB |
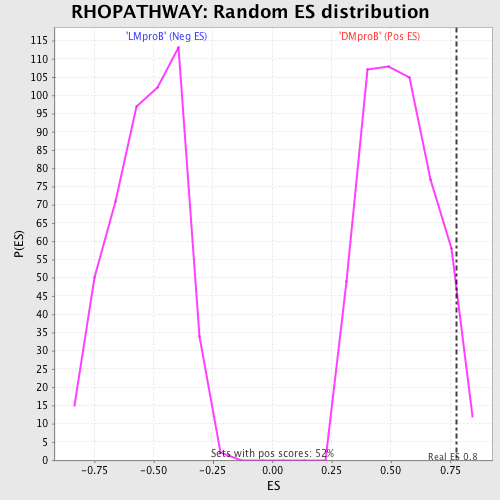
| GeneSet | RHOPATHWAY |
| Enrichment Score (ES) | 0.77593046 |
| Normalized Enrichment Score (NES) | 1.4455025 |
| Nominal p-value | 0.044573642 |
| FDR q-value | 0.7441884 |
| FWER p-Value | 1.0 |
| PROBE | DESCRIPTION (from dataset) | GENE SYMBOL | GENE_TITLE | RANK IN GENE LIST | RANK METRIC SCORE | RUNNING ES | CORE ENRICHMENT | |
|---|---|---|---|---|---|---|---|---|
| 1 | ARHGEF1 | 1952 18343 3996 | 7 | 3.371 | 0.5137 | Yes | ||
| 2 | ARHGAP4 | 9343 | 235 | 0.567 | 0.5879 | Yes | ||
| 3 | MYLK | 22778 4213 | 277 | 0.494 | 0.6610 | Yes | ||
| 4 | ARPC1B | 3512 8628 | 605 | 0.270 | 0.6846 | Yes | ||
| 5 | VCL | 22083 | 701 | 0.238 | 0.7157 | Yes | ||
| 6 | ARPC3 | 12109 | 740 | 0.227 | 0.7482 | Yes | ||
| 7 | ARPC2 | 14225 | 867 | 0.198 | 0.7717 | Yes | ||
| 8 | CFL1 | 4516 | 1320 | 0.130 | 0.7673 | Yes | ||
| 9 | TLN1 | 15899 | 1871 | 0.081 | 0.7500 | Yes | ||
| 10 | PIP5K1A | 23708 | 1916 | 0.078 | 0.7596 | Yes | ||
| 11 | ROCK1 | 5386 | 2079 | 0.067 | 0.7611 | Yes | ||
| 12 | MYL2 | 16713 | 2114 | 0.064 | 0.7691 | Yes | ||
| 13 | PIP5K1B | 5251 1841 | 2307 | 0.056 | 0.7673 | Yes | ||
| 14 | ARPC1A | 3541 16628 3519 | 2390 | 0.052 | 0.7708 | Yes | ||
| 15 | ARHGAP1 | 6001 10448 | 2436 | 0.050 | 0.7759 | Yes | ||
| 16 | BAIAP2 | 449 4236 | 4007 | 0.016 | 0.6939 | No | ||
| 17 | ARHGAP5 | 4412 8625 | 6663 | 0.004 | 0.5518 | No | ||
| 18 | ACTR2 | 20523 | 8403 | 0.001 | 0.4584 | No | ||
| 19 | ACTR3 | 13166 | 8962 | 0.000 | 0.4283 | No | ||
| 20 | LIMK1 | 16350 | 9662 | -0.001 | 0.3909 | No | ||
| 21 | ARHGAP6 | 24207 | 10038 | -0.002 | 0.3710 | No | ||
| 22 | SRC | 5507 | 12717 | -0.008 | 0.2281 | No | ||
| 23 | ARHGEF11 | 10028 | 14247 | -0.015 | 0.1482 | No | ||
| 24 | OPHN1 | 24102 | 15161 | -0.025 | 0.1029 | No | ||
| 25 | GSN | 2784 | 16427 | -0.065 | 0.0448 | No | ||
| 26 | ARHGEF5 | 12025 | 16659 | -0.079 | 0.0444 | No | ||
| 27 | PFN1 | 9555 | 17745 | -0.186 | 0.0144 | No | ||
| 28 | ARPC4 | 12642 | 17888 | -0.212 | 0.0392 | No |