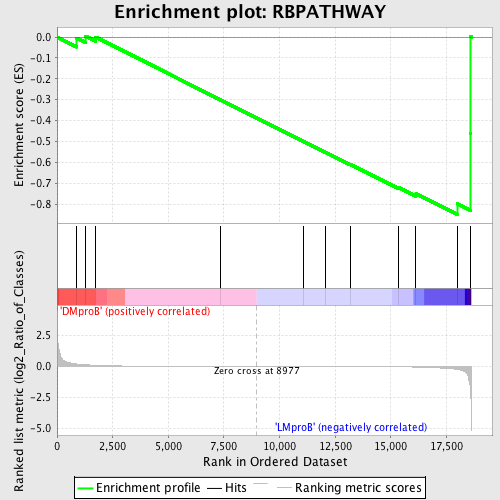
Profile of the Running ES Score & Positions of GeneSet Members on the Rank Ordered List
| Dataset | Set_04_DMproB_versus_LMproB.phenotype_DMproB_versus_LMproB.cls #DMproB_versus_LMproB |
| Phenotype | phenotype_DMproB_versus_LMproB.cls#DMproB_versus_LMproB |
| Upregulated in class | LMproB |
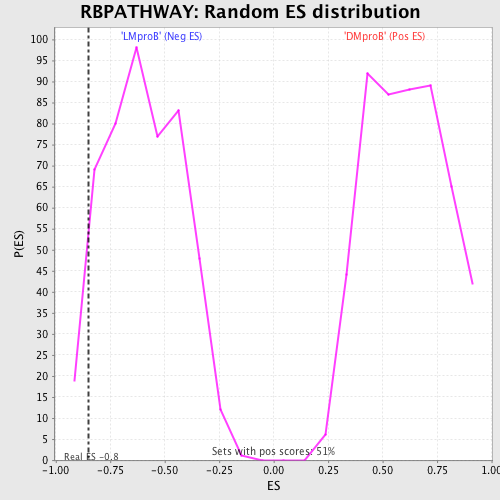
| GeneSet | RBPATHWAY |
| Enrichment Score (ES) | -0.8499202 |
| Normalized Enrichment Score (NES) | -1.431855 |
| Nominal p-value | 0.049281314 |
| FDR q-value | 0.6686873 |
| FWER p-Value | 1.0 |
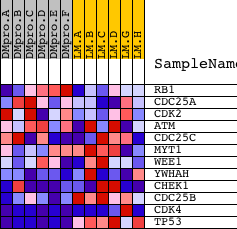
| PROBE | DESCRIPTION (from dataset) | GENE SYMBOL | GENE_TITLE | RANK IN GENE LIST | RANK METRIC SCORE | RUNNING ES | CORE ENRICHMENT | |
|---|---|---|---|---|---|---|---|---|
| 1 | RB1 | 21754 | 887 | 0.194 | -0.0044 | No | ||
| 2 | CDC25A | 8721 | 1280 | 0.135 | 0.0046 | No | ||
| 3 | CDK2 | 3438 3373 19592 3322 | 1735 | 0.090 | 0.0003 | No | ||
| 4 | ATM | 2976 19115 | 7358 | 0.003 | -0.3012 | No | ||
| 5 | CDC25C | 23468 1954 1977 | 11055 | -0.004 | -0.4991 | No | ||
| 6 | MYT1 | 36 | 12071 | -0.006 | -0.5523 | No | ||
| 7 | WEE1 | 18127 | 13180 | -0.009 | -0.6099 | No | ||
| 8 | YWHAH | 5937 10368 | 15332 | -0.028 | -0.7192 | No | ||
| 9 | CHEK1 | 19181 3085 | 16130 | -0.052 | -0.7504 | No | ||
| 10 | CDC25B | 14841 | 17982 | -0.234 | -0.7978 | Yes | ||
| 11 | CDK4 | 3424 19859 | 18570 | -1.651 | -0.4619 | Yes | ||
| 12 | TP53 | 20822 | 18592 | -2.086 | 0.0013 | Yes |