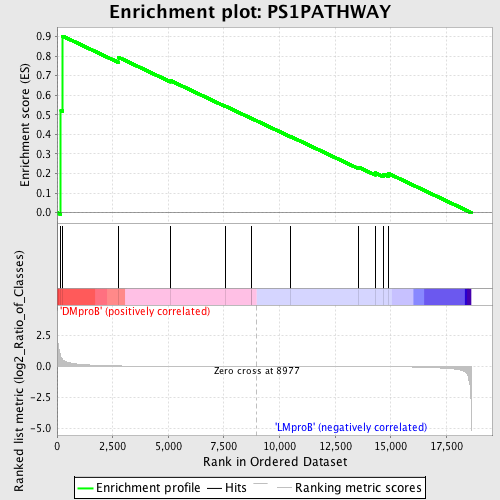
Profile of the Running ES Score & Positions of GeneSet Members on the Rank Ordered List
| Dataset | Set_04_DMproB_versus_LMproB.phenotype_DMproB_versus_LMproB.cls #DMproB_versus_LMproB |
| Phenotype | phenotype_DMproB_versus_LMproB.cls#DMproB_versus_LMproB |
| Upregulated in class | DMproB |
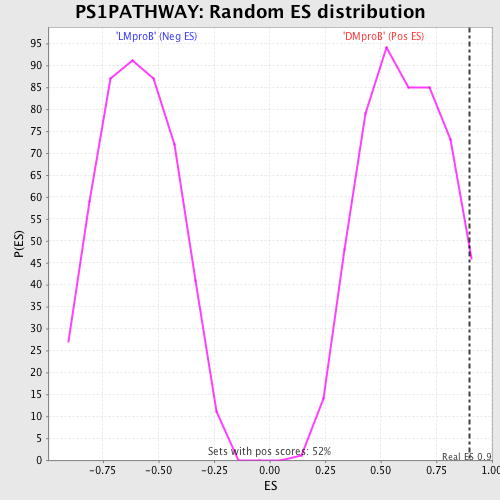
| GeneSet | PS1PATHWAY |
| Enrichment Score (ES) | 0.9016614 |
| Normalized Enrichment Score (NES) | 1.4843283 |
| Nominal p-value | 0.041904762 |
| FDR q-value | 0.6760261 |
| FWER p-Value | 1.0 |
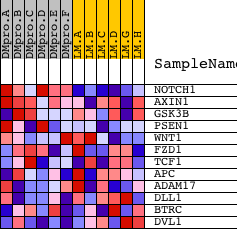
| PROBE | DESCRIPTION (from dataset) | GENE SYMBOL | GENE_TITLE | RANK IN GENE LIST | RANK METRIC SCORE | RUNNING ES | CORE ENRICHMENT | |
|---|---|---|---|---|---|---|---|---|
| 1 | NOTCH1 | 14649 | 172 | 0.749 | 0.5222 | Yes | ||
| 2 | AXIN1 | 1579 23330 | 250 | 0.540 | 0.9017 | Yes | ||
| 3 | GSK3B | 22761 | 2764 | 0.038 | 0.7932 | No | ||
| 4 | PSEN1 | 5297 2125 9630 | 5110 | 0.009 | 0.6738 | No | ||
| 5 | WNT1 | 22371 | 7563 | 0.003 | 0.5439 | No | ||
| 6 | FZD1 | 16923 | 8725 | 0.000 | 0.4818 | No | ||
| 7 | TCF1 | 16416 | 8741 | 0.000 | 0.4812 | No | ||
| 8 | APC | 4396 2022 | 10508 | -0.003 | 0.3881 | No | ||
| 9 | ADAM17 | 4343 | 13538 | -0.011 | 0.2330 | No | ||
| 10 | DLL1 | 23119 | 14298 | -0.016 | 0.2034 | No | ||
| 11 | BTRC | 4459 | 14663 | -0.019 | 0.1971 | No | ||
| 12 | DVL1 | 2412 15960 | 14899 | -0.022 | 0.1998 | No |