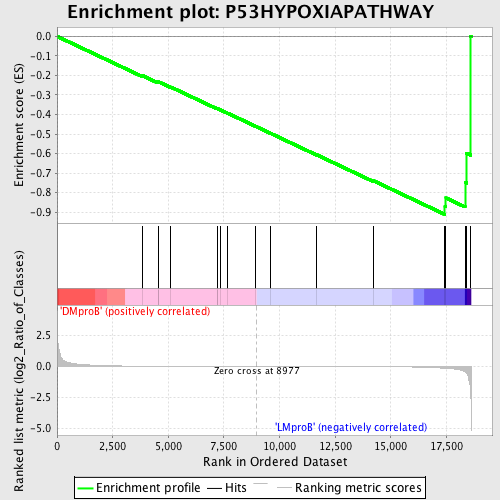
Profile of the Running ES Score & Positions of GeneSet Members on the Rank Ordered List
| Dataset | Set_04_DMproB_versus_LMproB.phenotype_DMproB_versus_LMproB.cls #DMproB_versus_LMproB |
| Phenotype | phenotype_DMproB_versus_LMproB.cls#DMproB_versus_LMproB |
| Upregulated in class | LMproB |
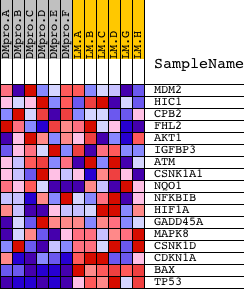
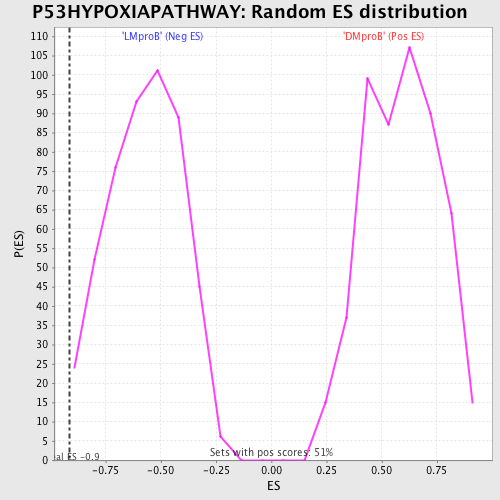
| GeneSet | P53HYPOXIAPATHWAY |
| Enrichment Score (ES) | -0.91185385 |
| Normalized Enrichment Score (NES) | -1.5907121 |
| Nominal p-value | 0.008230452 |
| FDR q-value | 0.7695962 |
| FWER p-Value | 0.764 |
| PROBE | DESCRIPTION (from dataset) | GENE SYMBOL | GENE_TITLE | RANK IN GENE LIST | RANK METRIC SCORE | RUNNING ES | CORE ENRICHMENT | |
|---|---|---|---|---|---|---|---|---|
| 1 | MDM2 | 19620 3327 | 3839 | 0.018 | -0.2012 | No | ||
| 2 | HIC1 | 20350 | 4537 | 0.012 | -0.2351 | No | ||
| 3 | CPB2 | 21958 2894 3525 | 4540 | 0.012 | -0.2316 | No | ||
| 4 | FHL2 | 13966 | 5104 | 0.009 | -0.2592 | No | ||
| 5 | AKT1 | 8568 | 7187 | 0.003 | -0.3701 | No | ||
| 6 | IGFBP3 | 4898 | 7202 | 0.003 | -0.3699 | No | ||
| 7 | ATM | 2976 19115 | 7358 | 0.003 | -0.3774 | No | ||
| 8 | CSNK1A1 | 8204 | 7665 | 0.002 | -0.3931 | No | ||
| 9 | NQO1 | 18754 3836 | 8904 | 0.000 | -0.4596 | No | ||
| 10 | NFKBIB | 17906 | 9612 | -0.001 | -0.4974 | No | ||
| 11 | HIF1A | 4850 | 11667 | -0.005 | -0.6063 | No | ||
| 12 | GADD45A | 17129 | 14234 | -0.015 | -0.7399 | No | ||
| 13 | MAPK8 | 6459 | 17434 | -0.147 | -0.8690 | Yes | ||
| 14 | CSNK1D | 4181 8352 1387 | 17478 | -0.151 | -0.8272 | Yes | ||
| 15 | CDKN1A | 4511 8729 | 18339 | -0.430 | -0.7478 | Yes | ||
| 16 | BAX | 17832 | 18406 | -0.524 | -0.5981 | Yes | ||
| 17 | TP53 | 20822 | 18592 | -2.086 | 0.0013 | Yes |