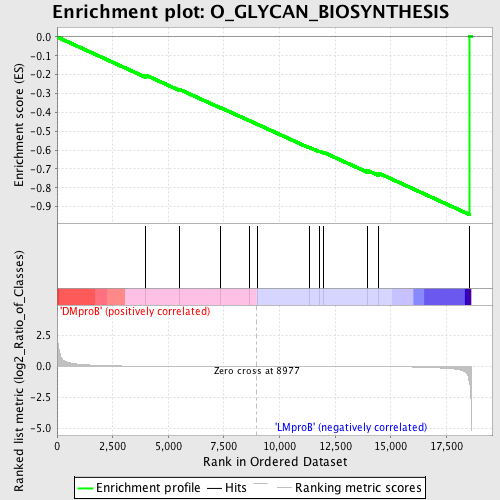
Profile of the Running ES Score & Positions of GeneSet Members on the Rank Ordered List
| Dataset | Set_04_DMproB_versus_LMproB.phenotype_DMproB_versus_LMproB.cls #DMproB_versus_LMproB |
| Phenotype | phenotype_DMproB_versus_LMproB.cls#DMproB_versus_LMproB |
| Upregulated in class | LMproB |
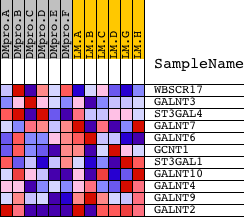
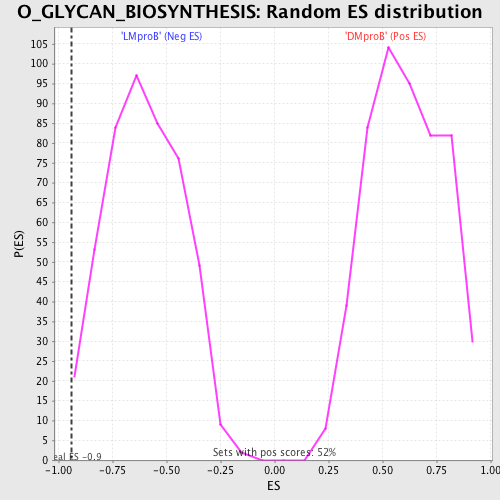
| GeneSet | O_GLYCAN_BIOSYNTHESIS |
| Enrichment Score (ES) | -0.9415542 |
| Normalized Enrichment Score (NES) | -1.5625572 |
| Nominal p-value | 0.006302521 |
| FDR q-value | 0.52021265 |
| FWER p-Value | 0.925 |
| PROBE | DESCRIPTION (from dataset) | GENE SYMBOL | GENE_TITLE | RANK IN GENE LIST | RANK METRIC SCORE | RUNNING ES | CORE ENRICHMENT | |
|---|---|---|---|---|---|---|---|---|
| 1 | WBSCR17 | 16357 | 3986 | 0.016 | -0.2022 | No | ||
| 2 | GALNT3 | 4751 | 5506 | 0.008 | -0.2781 | No | ||
| 3 | ST3GAL4 | 9816 | 7364 | 0.003 | -0.3757 | No | ||
| 4 | GALNT7 | 18870 | 8656 | 0.001 | -0.4447 | No | ||
| 5 | GALNT6 | 22126 | 9023 | -0.000 | -0.4643 | No | ||
| 6 | GCNT1 | 23715 3749 3689 | 11326 | -0.004 | -0.5850 | No | ||
| 7 | ST3GAL1 | 5435 2227 | 11781 | -0.005 | -0.6055 | No | ||
| 8 | GALNT10 | 9345 1269 | 11969 | -0.006 | -0.6115 | No | ||
| 9 | GALNT4 | 19892 | 13948 | -0.013 | -0.7079 | No | ||
| 10 | GALNT9 | 16753 | 14463 | -0.017 | -0.7230 | Yes | ||
| 11 | GALNT2 | 4239 18424 | 18531 | -1.282 | 0.0046 | Yes |