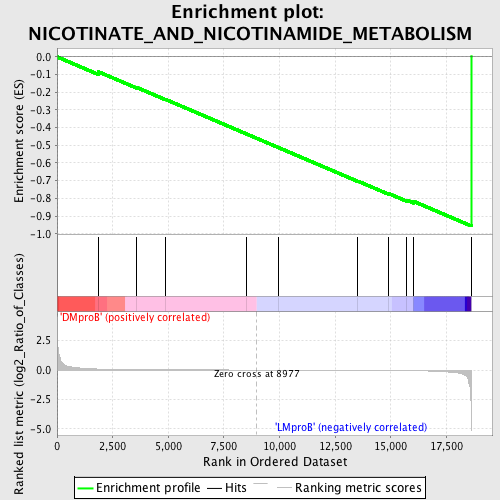
Profile of the Running ES Score & Positions of GeneSet Members on the Rank Ordered List
| Dataset | Set_04_DMproB_versus_LMproB.phenotype_DMproB_versus_LMproB.cls #DMproB_versus_LMproB |
| Phenotype | phenotype_DMproB_versus_LMproB.cls#DMproB_versus_LMproB |
| Upregulated in class | LMproB |
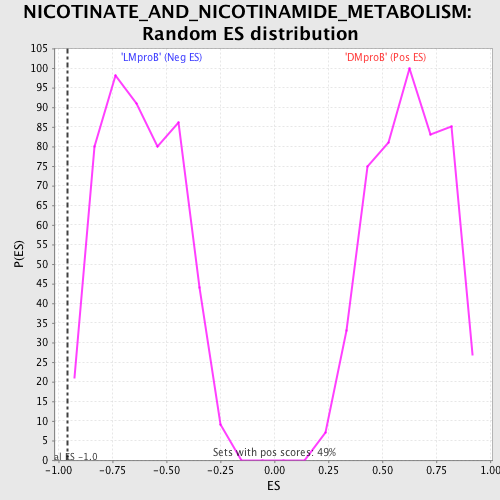
| GeneSet | NICOTINATE_AND_NICOTINAMIDE_METABOLISM |
| Enrichment Score (ES) | -0.95601344 |
| Normalized Enrichment Score (NES) | -1.5473583 |
| Nominal p-value | 0.003929273 |
| FDR q-value | 0.5529276 |
| FWER p-Value | 0.961 |
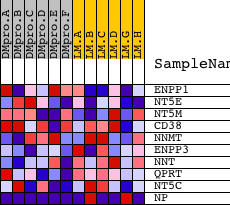
| PROBE | DESCRIPTION (from dataset) | GENE SYMBOL | GENE_TITLE | RANK IN GENE LIST | RANK METRIC SCORE | RUNNING ES | CORE ENRICHMENT | |
|---|---|---|---|---|---|---|---|---|
| 1 | ENPP1 | 19804 | 1854 | 0.082 | -0.0842 | No | ||
| 2 | NT5E | 19360 18702 | 3579 | 0.021 | -0.1729 | No | ||
| 3 | NT5M | 8345 4175 | 4884 | 0.010 | -0.2410 | No | ||
| 4 | CD38 | 16849 | 8492 | 0.001 | -0.4347 | No | ||
| 5 | NNMT | 19131 | 9961 | -0.002 | -0.5133 | No | ||
| 6 | ENPP3 | 19803 | 13516 | -0.011 | -0.7023 | No | ||
| 7 | NNT | 3273 5181 9471 3238 | 14890 | -0.021 | -0.7721 | No | ||
| 8 | QPRT | 17626 | 15718 | -0.037 | -0.8095 | No | ||
| 9 | NT5C | 20151 | 16035 | -0.048 | -0.8174 | Yes | ||
| 10 | NP | 22027 9597 5273 5274 | 18615 | -5.092 | 0.0001 | Yes |