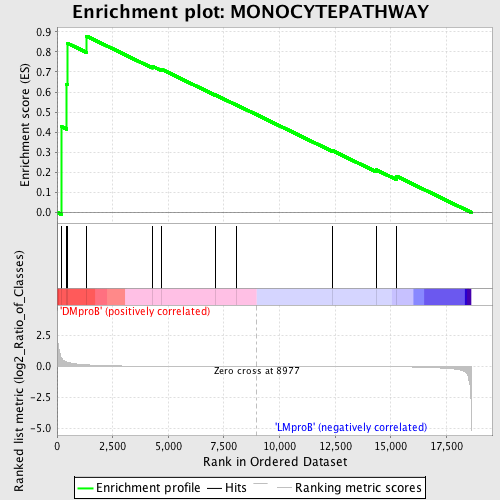
Profile of the Running ES Score & Positions of GeneSet Members on the Rank Ordered List
| Dataset | Set_04_DMproB_versus_LMproB.phenotype_DMproB_versus_LMproB.cls #DMproB_versus_LMproB |
| Phenotype | phenotype_DMproB_versus_LMproB.cls#DMproB_versus_LMproB |
| Upregulated in class | DMproB |
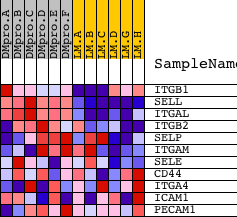
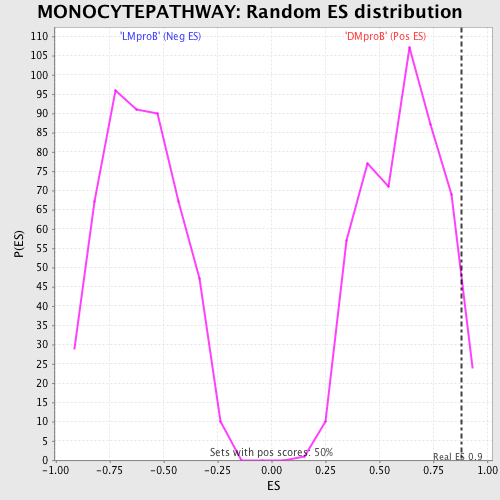
| GeneSet | MONOCYTEPATHWAY |
| Enrichment Score (ES) | 0.8784914 |
| Normalized Enrichment Score (NES) | 1.4345402 |
| Nominal p-value | 0.04771372 |
| FDR q-value | 0.69958854 |
| FWER p-Value | 1.0 |
| PROBE | DESCRIPTION (from dataset) | GENE SYMBOL | GENE_TITLE | RANK IN GENE LIST | RANK METRIC SCORE | RUNNING ES | CORE ENRICHMENT | |
|---|---|---|---|---|---|---|---|---|
| 1 | ITGB1 | 3872 18411 | 188 | 0.692 | 0.4277 | Yes | ||
| 2 | SELL | 9798 | 425 | 0.355 | 0.6396 | Yes | ||
| 3 | ITGAL | 9187 | 477 | 0.325 | 0.8421 | Yes | ||
| 4 | ITGB2 | 19978 | 1324 | 0.129 | 0.8785 | Yes | ||
| 5 | SELP | 14073 | 4282 | 0.014 | 0.7283 | No | ||
| 6 | ITGAM | 9188 | 4702 | 0.011 | 0.7129 | No | ||
| 7 | SELE | 14074 | 7111 | 0.003 | 0.5856 | No | ||
| 8 | CD44 | 2881 2847 2893 4499 2724 | 8061 | 0.002 | 0.5357 | No | ||
| 9 | ITGA4 | 4929 | 12398 | -0.007 | 0.3069 | No | ||
| 10 | ICAM1 | 19545 | 14337 | -0.016 | 0.2128 | No | ||
| 11 | PECAM1 | 5239 | 15266 | -0.027 | 0.1800 | No |