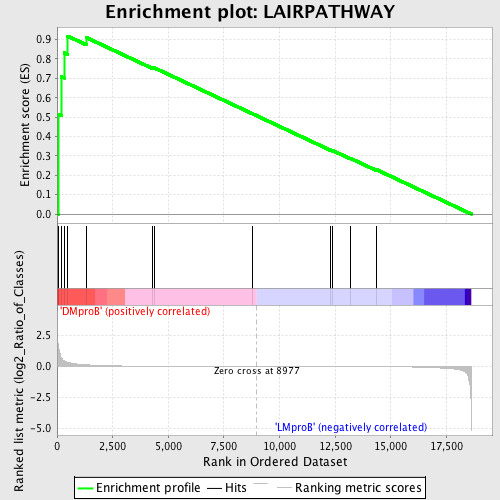
Profile of the Running ES Score & Positions of GeneSet Members on the Rank Ordered List
| Dataset | Set_04_DMproB_versus_LMproB.phenotype_DMproB_versus_LMproB.cls #DMproB_versus_LMproB |
| Phenotype | phenotype_DMproB_versus_LMproB.cls#DMproB_versus_LMproB |
| Upregulated in class | DMproB |
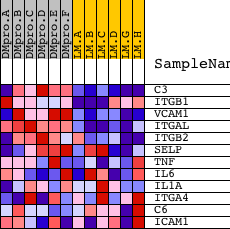
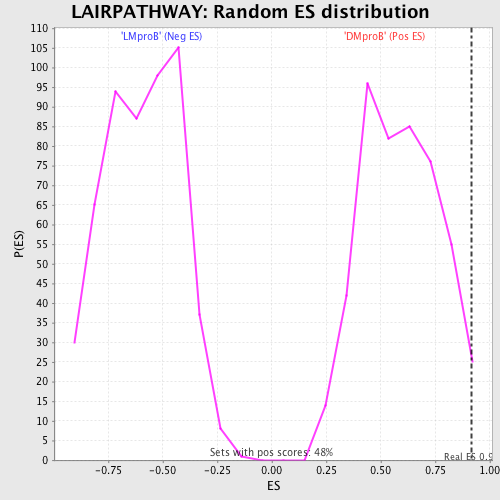
| GeneSet | LAIRPATHWAY |
| Enrichment Score (ES) | 0.9178474 |
| Normalized Enrichment Score (NES) | 1.5529186 |
| Nominal p-value | 0.014736842 |
| FDR q-value | 0.4237176 |
| FWER p-Value | 0.924 |
| PROBE | DESCRIPTION (from dataset) | GENE SYMBOL | GENE_TITLE | RANK IN GENE LIST | RANK METRIC SCORE | RUNNING ES | CORE ENRICHMENT | |
|---|---|---|---|---|---|---|---|---|
| 1 | C3 | 22915 | 43 | 1.780 | 0.5149 | Yes | ||
| 2 | ITGB1 | 3872 18411 | 188 | 0.692 | 0.7083 | Yes | ||
| 3 | VCAM1 | 5851 | 314 | 0.450 | 0.8322 | Yes | ||
| 4 | ITGAL | 9187 | 477 | 0.325 | 0.9178 | Yes | ||
| 5 | ITGB2 | 19978 | 1324 | 0.129 | 0.9100 | No | ||
| 6 | SELP | 14073 | 4282 | 0.014 | 0.7551 | No | ||
| 7 | TNF | 23004 | 4358 | 0.013 | 0.7549 | No | ||
| 8 | IL6 | 16895 | 8787 | 0.000 | 0.5170 | No | ||
| 9 | IL1A | 4915 | 12286 | -0.006 | 0.3308 | No | ||
| 10 | ITGA4 | 4929 | 12398 | -0.007 | 0.3268 | No | ||
| 11 | C6 | 22522 8671 | 13170 | -0.009 | 0.2880 | No | ||
| 12 | ICAM1 | 19545 | 14337 | -0.016 | 0.2300 | No |