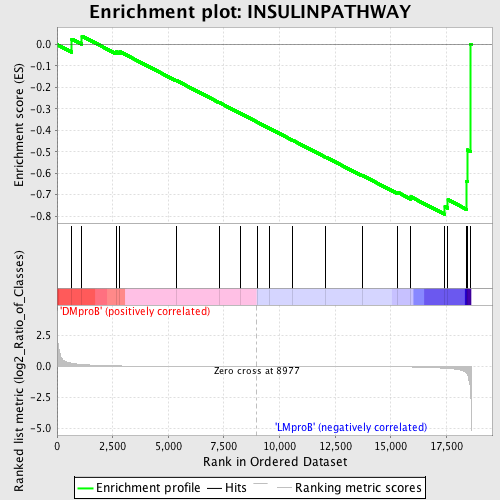
Profile of the Running ES Score & Positions of GeneSet Members on the Rank Ordered List
| Dataset | Set_04_DMproB_versus_LMproB.phenotype_DMproB_versus_LMproB.cls #DMproB_versus_LMproB |
| Phenotype | phenotype_DMproB_versus_LMproB.cls#DMproB_versus_LMproB |
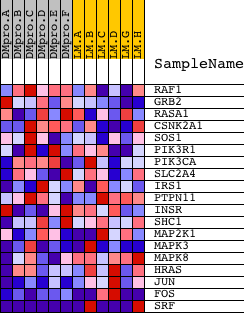
| Upregulated in class | LMproB |
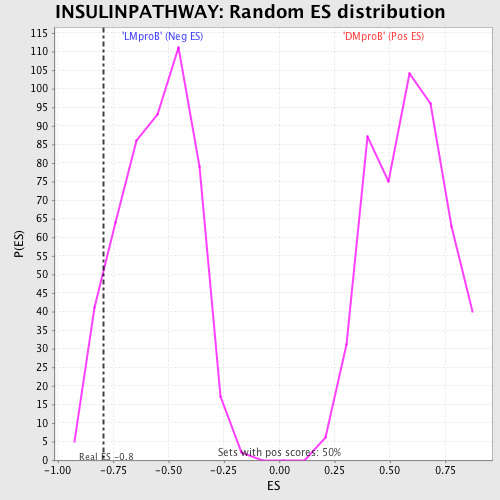
| GeneSet | INSULINPATHWAY |
| Enrichment Score (ES) | -0.79273075 |
| Normalized Enrichment Score (NES) | -1.4340273 |
| Nominal p-value | 0.07630522 |
| FDR q-value | 0.7282906 |
| FWER p-Value | 1.0 |
| PROBE | DESCRIPTION (from dataset) | GENE SYMBOL | GENE_TITLE | RANK IN GENE LIST | RANK METRIC SCORE | RUNNING ES | CORE ENRICHMENT | |
|---|---|---|---|---|---|---|---|---|
| 1 | RAF1 | 17035 | 660 | 0.250 | 0.0256 | No | ||
| 2 | GRB2 | 20149 | 1117 | 0.156 | 0.0394 | No | ||
| 3 | RASA1 | 10174 | 2654 | 0.041 | -0.0331 | No | ||
| 4 | CSNK2A1 | 14797 | 2823 | 0.036 | -0.0334 | No | ||
| 5 | SOS1 | 5476 | 5345 | 0.008 | -0.1669 | No | ||
| 6 | PIK3R1 | 3170 | 7286 | 0.003 | -0.2704 | No | ||
| 7 | PIK3CA | 9562 | 8243 | 0.001 | -0.3215 | No | ||
| 8 | SLC2A4 | 20380 | 9016 | -0.000 | -0.3630 | No | ||
| 9 | IRS1 | 4925 | 9553 | -0.001 | -0.3916 | No | ||
| 10 | PTPN11 | 5326 16391 9660 | 10593 | -0.003 | -0.4468 | No | ||
| 11 | INSR | 18950 | 12083 | -0.006 | -0.5254 | No | ||
| 12 | SHC1 | 9813 9812 5430 | 13709 | -0.012 | -0.6099 | No | ||
| 13 | MAP2K1 | 19082 | 15305 | -0.028 | -0.6889 | No | ||
| 14 | MAPK3 | 6458 11170 | 15904 | -0.043 | -0.7105 | No | ||
| 15 | MAPK8 | 6459 | 17434 | -0.147 | -0.7568 | Yes | ||
| 16 | HRAS | 4868 | 17569 | -0.163 | -0.7240 | Yes | ||
| 17 | JUN | 15832 | 18408 | -0.531 | -0.6390 | Yes | ||
| 18 | FOS | 21202 | 18435 | -0.608 | -0.4916 | Yes | ||
| 19 | SRF | 22961 1597 | 18585 | -2.048 | 0.0017 | Yes |