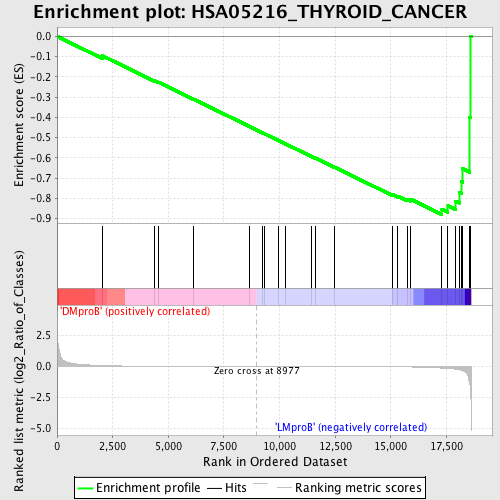
Profile of the Running ES Score & Positions of GeneSet Members on the Rank Ordered List
| Dataset | Set_04_DMproB_versus_LMproB.phenotype_DMproB_versus_LMproB.cls #DMproB_versus_LMproB |
| Phenotype | phenotype_DMproB_versus_LMproB.cls#DMproB_versus_LMproB |
| Upregulated in class | LMproB |
| GeneSet | HSA05216_THYROID_CANCER |
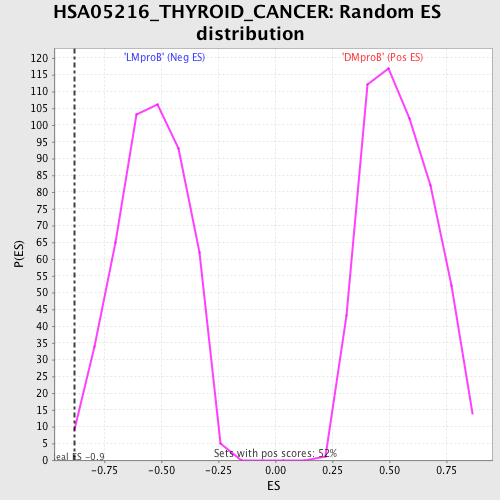
| Enrichment Score (ES) | -0.8799881 |
| Normalized Enrichment Score (NES) | -1.622557 |
| Nominal p-value | 0.008385744 |
| FDR q-value | 0.81049824 |
| FWER p-Value | 0.55 |
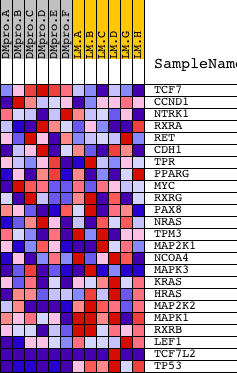
| PROBE | DESCRIPTION (from dataset) | GENE SYMBOL | GENE_TITLE | RANK IN GENE LIST | RANK METRIC SCORE | RUNNING ES | CORE ENRICHMENT | |
|---|---|---|---|---|---|---|---|---|
| 1 | TCF7 | 1467 20466 | 2027 | 0.070 | -0.0954 | No | ||
| 2 | CCND1 | 4487 4488 8707 17535 | 4387 | 0.013 | -0.2198 | No | ||
| 3 | NTRK1 | 15299 | 4564 | 0.012 | -0.2269 | No | ||
| 4 | RXRA | 9767 | 6150 | 0.006 | -0.3111 | No | ||
| 5 | RET | 17028 | 8625 | 0.001 | -0.4440 | No | ||
| 6 | CDH1 | 18479 | 9229 | -0.000 | -0.4764 | No | ||
| 7 | TPR | 927 4255 | 9304 | -0.001 | -0.4802 | No | ||
| 8 | PPARG | 1151 1144 17319 | 9960 | -0.002 | -0.5151 | No | ||
| 9 | MYC | 22465 9435 | 10267 | -0.002 | -0.5312 | No | ||
| 10 | RXRG | 14063 | 11439 | -0.004 | -0.5933 | No | ||
| 11 | PAX8 | 2791 14671 | 11592 | -0.005 | -0.6006 | No | ||
| 12 | NRAS | 5191 | 12478 | -0.007 | -0.6468 | No | ||
| 13 | TPM3 | 12233 7209 7208 1790 | 15069 | -0.024 | -0.7815 | No | ||
| 14 | MAP2K1 | 19082 | 15305 | -0.028 | -0.7889 | No | ||
| 15 | NCOA4 | 2746 6550 | 15753 | -0.038 | -0.8055 | No | ||
| 16 | MAPK3 | 6458 11170 | 15904 | -0.043 | -0.8052 | No | ||
| 17 | KRAS | 9247 | 17295 | -0.133 | -0.8543 | Yes | ||
| 18 | HRAS | 4868 | 17569 | -0.163 | -0.8375 | Yes | ||
| 19 | MAP2K2 | 19933 | 17921 | -0.219 | -0.8140 | Yes | ||
| 20 | MAPK1 | 1642 11167 | 18096 | -0.272 | -0.7709 | Yes | ||
| 21 | RXRB | 23285 9768 | 18169 | -0.298 | -0.7172 | Yes | ||
| 22 | LEF1 | 1860 15420 | 18235 | -0.344 | -0.6543 | Yes | ||
| 23 | TCF7L2 | 10048 5646 | 18551 | -1.410 | -0.3992 | Yes | ||
| 24 | TP53 | 20822 | 18592 | -2.086 | 0.0013 | Yes |