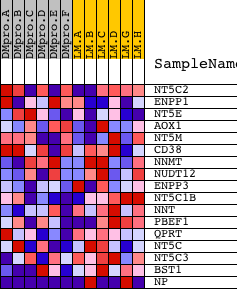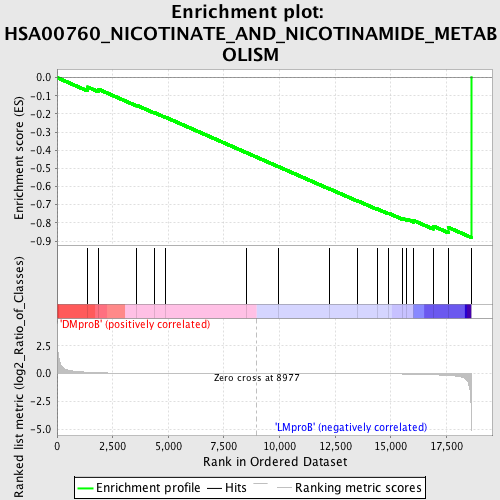
Profile of the Running ES Score & Positions of GeneSet Members on the Rank Ordered List
| Dataset | Set_04_DMproB_versus_LMproB.phenotype_DMproB_versus_LMproB.cls #DMproB_versus_LMproB |
| Phenotype | phenotype_DMproB_versus_LMproB.cls#DMproB_versus_LMproB |
| Upregulated in class | LMproB |
| GeneSet | HSA00760_NICOTINATE_AND_NICOTINAMIDE_METABOLISM |
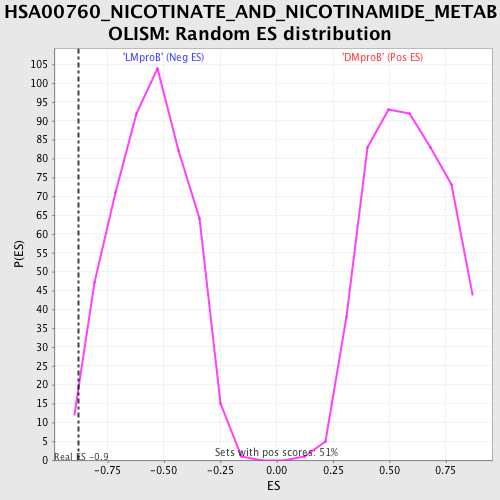
| Enrichment Score (ES) | -0.8804059 |
| Normalized Enrichment Score (NES) | -1.5707566 |
| Nominal p-value | 0.0102459015 |
| FDR q-value | 0.745721 |
| FWER p-Value | 0.89 |
| PROBE | DESCRIPTION (from dataset) | GENE SYMBOL | GENE_TITLE | RANK IN GENE LIST | RANK METRIC SCORE | RUNNING ES | CORE ENRICHMENT | |
|---|---|---|---|---|---|---|---|---|
| 1 | NT5C2 | 3768 8052 | 1363 | 0.125 | -0.0517 | No | ||
| 2 | ENPP1 | 19804 | 1854 | 0.082 | -0.0638 | No | ||
| 3 | NT5E | 19360 18702 | 3579 | 0.021 | -0.1528 | No | ||
| 4 | AOX1 | 14246 4090 | 4367 | 0.013 | -0.1929 | No | ||
| 5 | NT5M | 8345 4175 | 4884 | 0.010 | -0.2188 | No | ||
| 6 | CD38 | 16849 | 8492 | 0.001 | -0.4126 | No | ||
| 7 | NNMT | 19131 | 9961 | -0.002 | -0.4913 | No | ||
| 8 | NUDT12 | 7518 | 12250 | -0.006 | -0.6132 | No | ||
| 9 | ENPP3 | 19803 | 13516 | -0.011 | -0.6793 | No | ||
| 10 | NT5C1B | 21315 | 14385 | -0.016 | -0.7232 | No | ||
| 11 | NNT | 3273 5181 9471 3238 | 14890 | -0.021 | -0.7466 | No | ||
| 12 | PBEF1 | 2116 | 15502 | -0.032 | -0.7739 | No | ||
| 13 | QPRT | 17626 | 15718 | -0.037 | -0.7790 | No | ||
| 14 | NT5C | 20151 | 16035 | -0.048 | -0.7876 | No | ||
| 15 | NT5C3 | 17136 | 16899 | -0.096 | -0.8174 | No | ||
| 16 | BST1 | 16850 | 17602 | -0.168 | -0.8260 | Yes | ||
| 17 | NP | 22027 9597 5273 5274 | 18615 | -5.092 | 0.0001 | Yes |