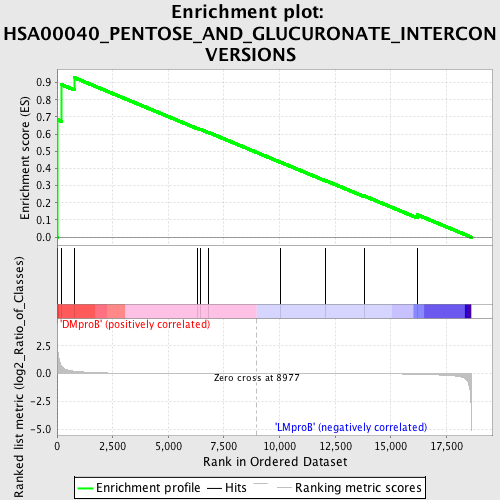
Profile of the Running ES Score & Positions of GeneSet Members on the Rank Ordered List
| Dataset | Set_04_DMproB_versus_LMproB.phenotype_DMproB_versus_LMproB.cls #DMproB_versus_LMproB |
| Phenotype | phenotype_DMproB_versus_LMproB.cls#DMproB_versus_LMproB |
| Upregulated in class | DMproB |
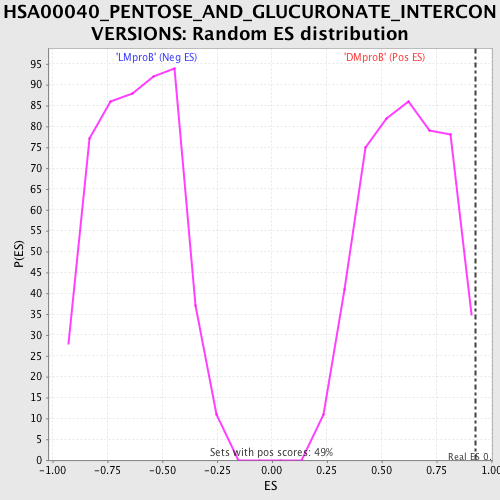
| GeneSet | HSA00040_PENTOSE_AND_GLUCURONATE_INTERCONVERSIONS |
| Enrichment Score (ES) | 0.92911154 |
| Normalized Enrichment Score (NES) | 1.5210587 |
| Nominal p-value | 0.02053388 |
| FDR q-value | 0.551939 |
| FWER p-Value | 0.989 |
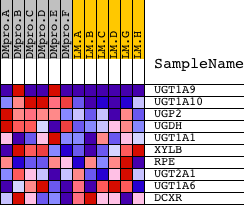
| PROBE | DESCRIPTION (from dataset) | GENE SYMBOL | GENE_TITLE | RANK IN GENE LIST | RANK METRIC SCORE | RUNNING ES | CORE ENRICHMENT | |
|---|---|---|---|---|---|---|---|---|
| 1 | UGT1A9 | 11849 11850 | 31 | 2.066 | 0.6833 | Yes | ||
| 2 | UGT1A10 | 6908 | 203 | 0.644 | 0.8877 | Yes | ||
| 3 | UGP2 | 20518 | 770 | 0.217 | 0.9291 | Yes | ||
| 4 | UGDH | 10249 | 6325 | 0.005 | 0.6324 | No | ||
| 5 | UGT1A1 | 11851 | 6428 | 0.005 | 0.6285 | No | ||
| 6 | XYLB | 19277 | 6822 | 0.004 | 0.6088 | No | ||
| 7 | RPE | 14232 | 10055 | -0.002 | 0.4357 | No | ||
| 8 | UGT2A1 | 8247 | 12078 | -0.006 | 0.3289 | No | ||
| 9 | UGT1A6 | 3969 4079 6911 13591 | 13803 | -0.012 | 0.2404 | No | ||
| 10 | DCXR | 20108 | 16191 | -0.055 | 0.1303 | No |