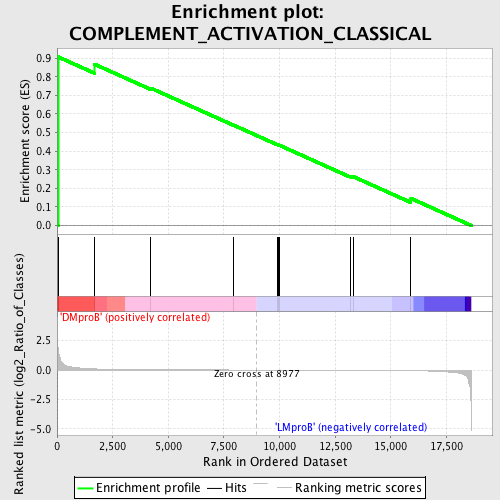
Profile of the Running ES Score & Positions of GeneSet Members on the Rank Ordered List
| Dataset | Set_04_DMproB_versus_LMproB.phenotype_DMproB_versus_LMproB.cls #DMproB_versus_LMproB |
| Phenotype | phenotype_DMproB_versus_LMproB.cls#DMproB_versus_LMproB |
| Upregulated in class | DMproB |
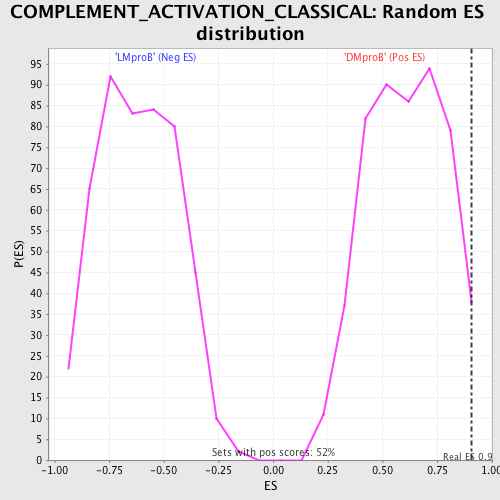
| GeneSet | COMPLEMENT_ACTIVATION_CLASSICAL |
| Enrichment Score (ES) | 0.90681034 |
| Normalized Enrichment Score (NES) | 1.4806339 |
| Nominal p-value | 0.01934236 |
| FDR q-value | 0.6510425 |
| FWER p-Value | 1.0 |
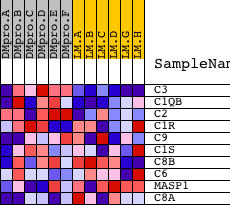
| PROBE | DESCRIPTION (from dataset) | GENE SYMBOL | GENE_TITLE | RANK IN GENE LIST | RANK METRIC SCORE | RUNNING ES | CORE ENRICHMENT | |
|---|---|---|---|---|---|---|---|---|
| 1 | C3 | 22915 | 43 | 1.780 | 0.9068 | Yes | ||
| 2 | C1QB | 8667 | 1672 | 0.095 | 0.8678 | No | ||
| 3 | C2 | 23013 | 4215 | 0.014 | 0.7385 | No | ||
| 4 | C1R | 11942 6951 6952 | 7916 | 0.002 | 0.5406 | No | ||
| 5 | C9 | 22518 2246 | 9894 | -0.001 | 0.4351 | No | ||
| 6 | C1S | 6950 6949 | 9942 | -0.002 | 0.4334 | No | ||
| 7 | C8B | 16163 | 9999 | -0.002 | 0.4312 | No | ||
| 8 | C6 | 22522 8671 | 13170 | -0.009 | 0.2655 | No | ||
| 9 | MASP1 | 1632 22626 | 13328 | -0.010 | 0.2621 | No | ||
| 10 | C8A | 15823 | 15903 | -0.043 | 0.1458 | No |