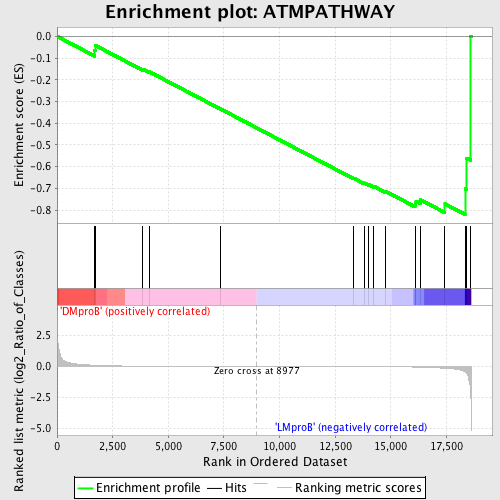
Profile of the Running ES Score & Positions of GeneSet Members on the Rank Ordered List
| Dataset | Set_04_DMproB_versus_LMproB.phenotype_DMproB_versus_LMproB.cls #DMproB_versus_LMproB |
| Phenotype | phenotype_DMproB_versus_LMproB.cls#DMproB_versus_LMproB |
| Upregulated in class | LMproB |
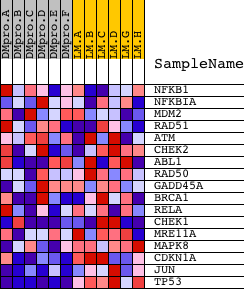
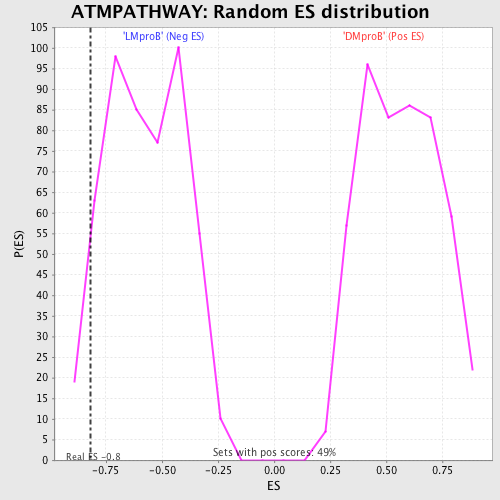
| GeneSet | ATMPATHWAY |
| Enrichment Score (ES) | -0.8201229 |
| Normalized Enrichment Score (NES) | -1.4320235 |
| Nominal p-value | 0.06706114 |
| FDR q-value | 0.7027684 |
| FWER p-Value | 1.0 |
| PROBE | DESCRIPTION (from dataset) | GENE SYMBOL | GENE_TITLE | RANK IN GENE LIST | RANK METRIC SCORE | RUNNING ES | CORE ENRICHMENT | |
|---|---|---|---|---|---|---|---|---|
| 1 | NFKB1 | 15160 | 1685 | 0.094 | -0.0648 | No | ||
| 2 | NFKBIA | 21065 | 1727 | 0.091 | -0.0421 | No | ||
| 3 | MDM2 | 19620 3327 | 3839 | 0.018 | -0.1507 | No | ||
| 4 | RAD51 | 2897 14903 | 4130 | 0.015 | -0.1622 | No | ||
| 5 | ATM | 2976 19115 | 7358 | 0.003 | -0.3349 | No | ||
| 6 | CHEK2 | 16751 3587 | 13338 | -0.010 | -0.6536 | No | ||
| 7 | ABL1 | 2693 4301 2794 | 13802 | -0.012 | -0.6751 | No | ||
| 8 | RAD50 | 1198 20460 | 13993 | -0.014 | -0.6816 | No | ||
| 9 | GADD45A | 17129 | 14234 | -0.015 | -0.6903 | No | ||
| 10 | BRCA1 | 20213 | 14751 | -0.020 | -0.7127 | No | ||
| 11 | RELA | 23783 | 16089 | -0.050 | -0.7708 | No | ||
| 12 | CHEK1 | 19181 3085 | 16130 | -0.052 | -0.7587 | No | ||
| 13 | MRE11A | 3014 19560 | 16341 | -0.062 | -0.7530 | No | ||
| 14 | MAPK8 | 6459 | 17434 | -0.147 | -0.7715 | Yes | ||
| 15 | CDKN1A | 4511 8729 | 18339 | -0.430 | -0.7022 | Yes | ||
| 16 | JUN | 15832 | 18408 | -0.531 | -0.5603 | Yes | ||
| 17 | TP53 | 20822 | 18592 | -2.086 | 0.0013 | Yes |