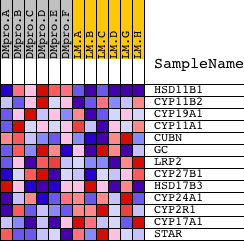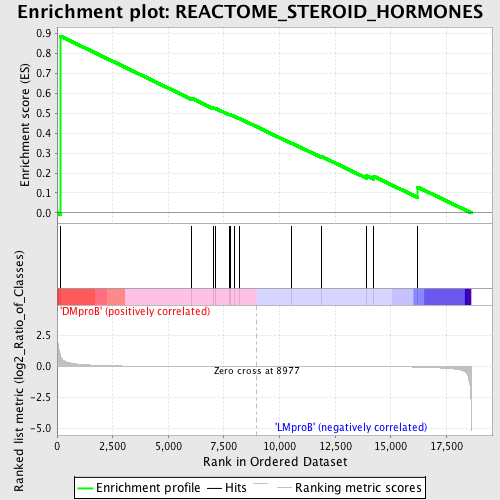
Profile of the Running ES Score & Positions of GeneSet Members on the Rank Ordered List
| Dataset | Set_04_DMproB_versus_LMproB.phenotype_DMproB_versus_LMproB.cls #DMproB_versus_LMproB |
| Phenotype | phenotype_DMproB_versus_LMproB.cls#DMproB_versus_LMproB |
| Upregulated in class | DMproB |
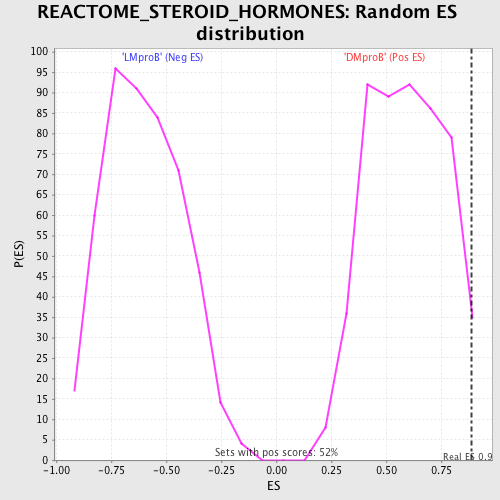
| GeneSet | REACTOME_STEROID_HORMONES |
| Enrichment Score (ES) | 0.88646686 |
| Normalized Enrichment Score (NES) | 1.4935464 |
| Nominal p-value | 0.030947777 |
| FDR q-value | 0.72507215 |
| FWER p-Value | 1.0 |
| PROBE | DESCRIPTION (from dataset) | GENE SYMBOL | GENE_TITLE | RANK IN GENE LIST | RANK METRIC SCORE | RUNNING ES | CORE ENRICHMENT | |
|---|---|---|---|---|---|---|---|---|
| 1 | HSD11B1 | 9125 4019 | 145 | 0.957 | 0.8865 | Yes | ||
| 2 | CYP11B2 | 24574 | 6058 | 0.006 | 0.5743 | No | ||
| 3 | CYP19A1 | 19112 | 7019 | 0.004 | 0.5262 | No | ||
| 4 | CYP11A1 | 4580 | 7102 | 0.003 | 0.5250 | No | ||
| 5 | CUBN | 14682 | 7731 | 0.002 | 0.4934 | No | ||
| 6 | GC | 16486 | 7772 | 0.002 | 0.4933 | No | ||
| 7 | LRP2 | 14566 14567 | 7989 | 0.002 | 0.4834 | No | ||
| 8 | CYP27B1 | 8831 3426 | 8188 | 0.001 | 0.4740 | No | ||
| 9 | HSD17B3 | 3231 21421 | 10542 | -0.003 | 0.3500 | No | ||
| 10 | CYP24A1 | 14328 | 11894 | -0.005 | 0.2824 | No | ||
| 11 | CYP2R1 | 17668 | 13921 | -0.013 | 0.1858 | No | ||
| 12 | CYP17A1 | 23651 | 14238 | -0.015 | 0.1831 | No | ||
| 13 | STAR | 5523 | 16214 | -0.056 | 0.1291 | No |