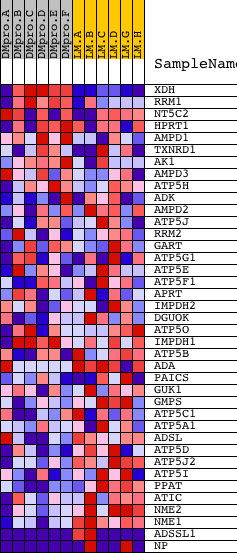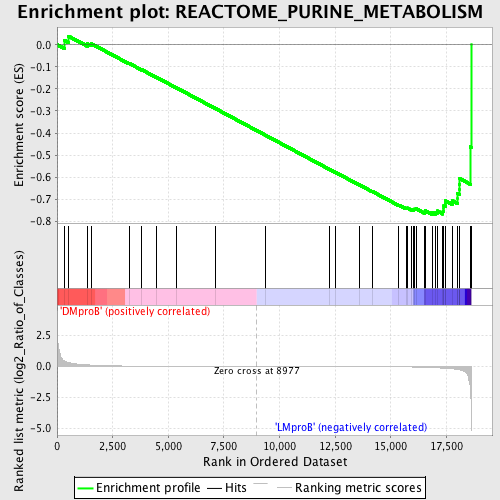
Profile of the Running ES Score & Positions of GeneSet Members on the Rank Ordered List
| Dataset | Set_04_DMproB_versus_LMproB.phenotype_DMproB_versus_LMproB.cls #DMproB_versus_LMproB |
| Phenotype | phenotype_DMproB_versus_LMproB.cls#DMproB_versus_LMproB |
| Upregulated in class | LMproB |
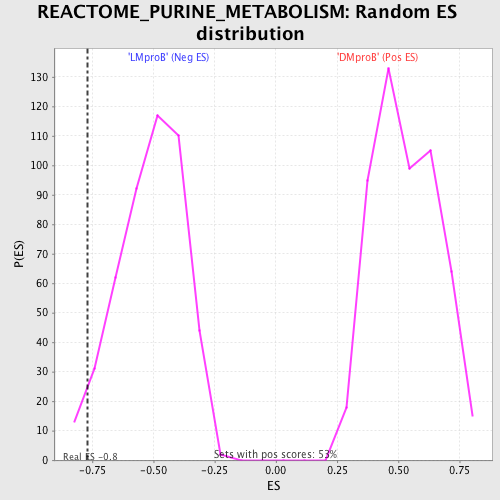
| GeneSet | REACTOME_PURINE_METABOLISM |
| Enrichment Score (ES) | -0.76879936 |
| Normalized Enrichment Score (NES) | -1.5081255 |
| Nominal p-value | 0.033970278 |
| FDR q-value | 0.70878476 |
| FWER p-Value | 1.0 |
| PROBE | DESCRIPTION (from dataset) | GENE SYMBOL | GENE_TITLE | RANK IN GENE LIST | RANK METRIC SCORE | RUNNING ES | CORE ENRICHMENT | |
|---|---|---|---|---|---|---|---|---|
| 1 | XDH | 22897 | 342 | 0.417 | 0.0196 | No | ||
| 2 | RRM1 | 18163 | 507 | 0.311 | 0.0391 | No | ||
| 3 | NT5C2 | 3768 8052 | 1363 | 0.125 | 0.0045 | No | ||
| 4 | HPRT1 | 2655 24339 408 | 1551 | 0.106 | 0.0041 | No | ||
| 5 | AMPD1 | 5051 | 3246 | 0.027 | -0.0847 | No | ||
| 6 | TXNRD1 | 19923 | 3808 | 0.018 | -0.1132 | No | ||
| 7 | AK1 | 4363 | 4469 | 0.013 | -0.1476 | No | ||
| 8 | AMPD3 | 4383 2110 | 5370 | 0.008 | -0.1953 | No | ||
| 9 | ATP5H | 12948 | 7100 | 0.003 | -0.2880 | No | ||
| 10 | ADK | 3302 3454 8555 | 9381 | -0.001 | -0.4107 | No | ||
| 11 | AMPD2 | 1931 15197 | 12251 | -0.006 | -0.5646 | No | ||
| 12 | ATP5J | 880 22555 | 12513 | -0.007 | -0.5780 | No | ||
| 13 | RRM2 | 5401 5400 | 13596 | -0.011 | -0.6352 | No | ||
| 14 | GART | 22543 1754 | 14162 | -0.015 | -0.6643 | No | ||
| 15 | ATP5G1 | 8636 | 15360 | -0.029 | -0.7261 | No | ||
| 16 | ATP5E | 14321 | 15685 | -0.036 | -0.7402 | No | ||
| 17 | ATP5F1 | 15212 | 15733 | -0.038 | -0.7393 | No | ||
| 18 | APRT | 8620 | 15911 | -0.043 | -0.7448 | No | ||
| 19 | IMPDH2 | 10730 | 16040 | -0.048 | -0.7473 | No | ||
| 20 | DGUOK | 17099 1041 | 16062 | -0.049 | -0.7439 | No | ||
| 21 | ATP5O | 22539 | 16134 | -0.052 | -0.7430 | No | ||
| 22 | IMPDH1 | 17197 1131 | 16527 | -0.070 | -0.7577 | No | ||
| 23 | ATP5B | 19846 | 16547 | -0.071 | -0.7522 | No | ||
| 24 | ADA | 2703 14361 | 16857 | -0.093 | -0.7603 | Yes | ||
| 25 | PAICS | 16820 | 16994 | -0.104 | -0.7582 | Yes | ||
| 26 | GUK1 | 20432 | 17082 | -0.110 | -0.7528 | Yes | ||
| 27 | GMPS | 15578 | 17344 | -0.139 | -0.7542 | Yes | ||
| 28 | ATP5C1 | 8635 | 17381 | -0.143 | -0.7431 | Yes | ||
| 29 | ATP5A1 | 23505 | 17384 | -0.143 | -0.7302 | Yes | ||
| 30 | ADSL | 4358 | 17460 | -0.149 | -0.7206 | Yes | ||
| 31 | ATP5D | 19949 | 17465 | -0.149 | -0.7072 | Yes | ||
| 32 | ATP5J2 | 12186 | 17758 | -0.189 | -0.7057 | Yes | ||
| 33 | ATP5I | 8637 | 17997 | -0.239 | -0.6967 | Yes | ||
| 34 | PPAT | 6081 | 18001 | -0.240 | -0.6750 | Yes | ||
| 35 | ATIC | 14231 3968 | 18078 | -0.266 | -0.6549 | Yes | ||
| 36 | NME2 | 9468 | 18085 | -0.268 | -0.6307 | Yes | ||
| 37 | NME1 | 9467 | 18100 | -0.274 | -0.6065 | Yes | ||
| 38 | ADSSL1 | 21136 2087 | 18575 | -1.859 | -0.4624 | Yes | ||
| 39 | NP | 22027 9597 5273 5274 | 18615 | -5.092 | 0.0001 | Yes |