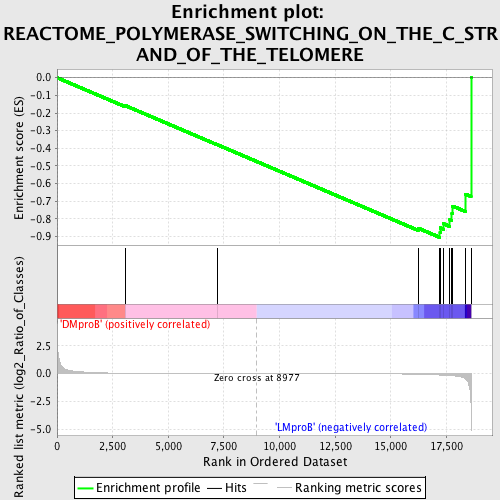
Profile of the Running ES Score & Positions of GeneSet Members on the Rank Ordered List
| Dataset | Set_04_DMproB_versus_LMproB.phenotype_DMproB_versus_LMproB.cls #DMproB_versus_LMproB |
| Phenotype | phenotype_DMproB_versus_LMproB.cls#DMproB_versus_LMproB |
| Upregulated in class | LMproB |
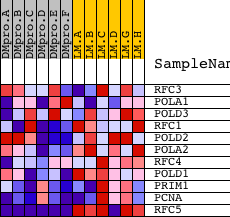
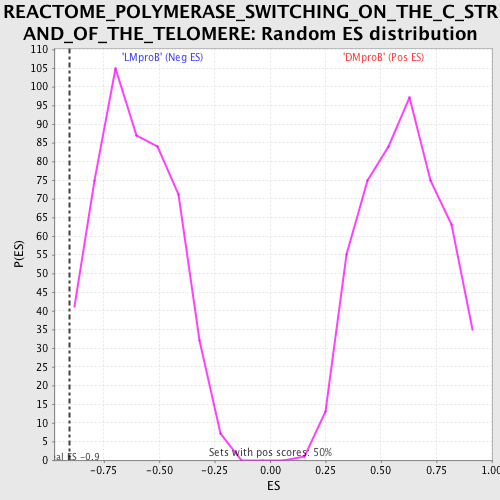
| GeneSet | REACTOME_POLYMERASE_SWITCHING_ON_THE_C_STRAND_OF_THE_TELOMERE |
| Enrichment Score (ES) | -0.9048224 |
| Normalized Enrichment Score (NES) | -1.4952598 |
| Nominal p-value | 0.017928287 |
| FDR q-value | 0.65744203 |
| FWER p-Value | 1.0 |
| PROBE | DESCRIPTION (from dataset) | GENE SYMBOL | GENE_TITLE | RANK IN GENE LIST | RANK METRIC SCORE | RUNNING ES | CORE ENRICHMENT | |
|---|---|---|---|---|---|---|---|---|
| 1 | RFC3 | 12786 | 3069 | 0.030 | -0.1583 | No | ||
| 2 | POLA1 | 24112 | 7190 | 0.003 | -0.3790 | No | ||
| 3 | POLD3 | 17742 | 16230 | -0.057 | -0.8523 | No | ||
| 4 | RFC1 | 16527 | 17209 | -0.123 | -0.8776 | Yes | ||
| 5 | POLD2 | 20537 | 17227 | -0.125 | -0.8507 | Yes | ||
| 6 | POLA2 | 23988 | 17357 | -0.140 | -0.8266 | Yes | ||
| 7 | RFC4 | 1735 22627 | 17652 | -0.174 | -0.8039 | Yes | ||
| 8 | POLD1 | 17847 | 17746 | -0.187 | -0.7676 | Yes | ||
| 9 | PRIM1 | 19847 | 17773 | -0.191 | -0.7268 | Yes | ||
| 10 | PCNA | 9535 | 18352 | -0.446 | -0.6592 | Yes | ||
| 11 | RFC5 | 13005 7791 | 18606 | -3.043 | 0.0005 | Yes |