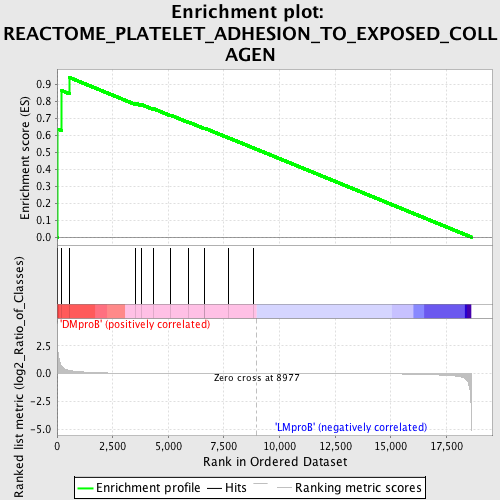
Profile of the Running ES Score & Positions of GeneSet Members on the Rank Ordered List
| Dataset | Set_04_DMproB_versus_LMproB.phenotype_DMproB_versus_LMproB.cls #DMproB_versus_LMproB |
| Phenotype | phenotype_DMproB_versus_LMproB.cls#DMproB_versus_LMproB |
| Upregulated in class | DMproB |
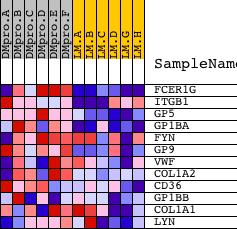
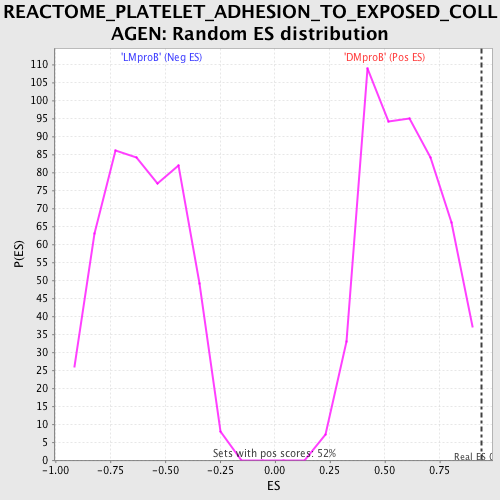
| GeneSet | REACTOME_PLATELET_ADHESION_TO_EXPOSED_COLLAGEN |
| Enrichment Score (ES) | 0.9420739 |
| Normalized Enrichment Score (NES) | 1.5935254 |
| Nominal p-value | 0.0038095238 |
| FDR q-value | 0.209343 |
| FWER p-Value | 0.809 |
| PROBE | DESCRIPTION (from dataset) | GENE SYMBOL | GENE_TITLE | RANK IN GENE LIST | RANK METRIC SCORE | RUNNING ES | CORE ENRICHMENT | |
|---|---|---|---|---|---|---|---|---|
| 1 | FCER1G | 13759 | 38 | 1.883 | 0.6384 | Yes | ||
| 2 | ITGB1 | 3872 18411 | 188 | 0.692 | 0.8659 | Yes | ||
| 3 | GP5 | 22616 | 563 | 0.283 | 0.9421 | Yes | ||
| 4 | GP1BA | 13683 | 3504 | 0.022 | 0.7916 | No | ||
| 5 | FYN | 3375 3395 20052 | 3774 | 0.019 | 0.7835 | No | ||
| 6 | GP9 | 17374 | 4331 | 0.013 | 0.7581 | No | ||
| 7 | VWF | 17277 | 5089 | 0.009 | 0.7207 | No | ||
| 8 | COL1A2 | 8772 | 5903 | 0.007 | 0.6792 | No | ||
| 9 | CD36 | 8712 | 6626 | 0.004 | 0.6419 | No | ||
| 10 | GP1BB | 9031 | 6627 | 0.004 | 0.6434 | No | ||
| 11 | COL1A1 | 8771 | 7716 | 0.002 | 0.5857 | No | ||
| 12 | LYN | 16281 | 8848 | 0.000 | 0.5250 | No |