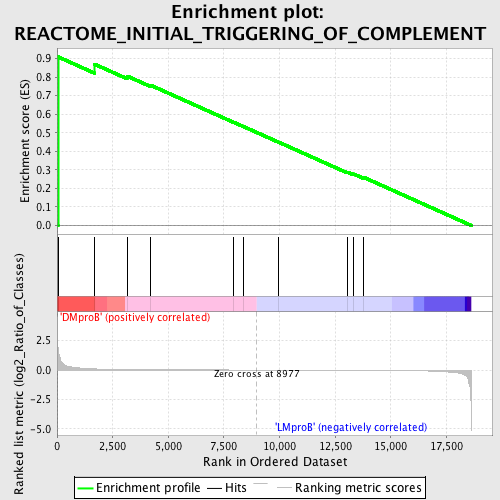
Profile of the Running ES Score & Positions of GeneSet Members on the Rank Ordered List
| Dataset | Set_04_DMproB_versus_LMproB.phenotype_DMproB_versus_LMproB.cls #DMproB_versus_LMproB |
| Phenotype | phenotype_DMproB_versus_LMproB.cls#DMproB_versus_LMproB |
| Upregulated in class | DMproB |
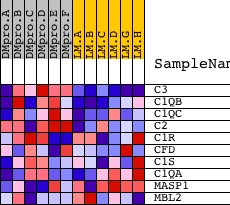
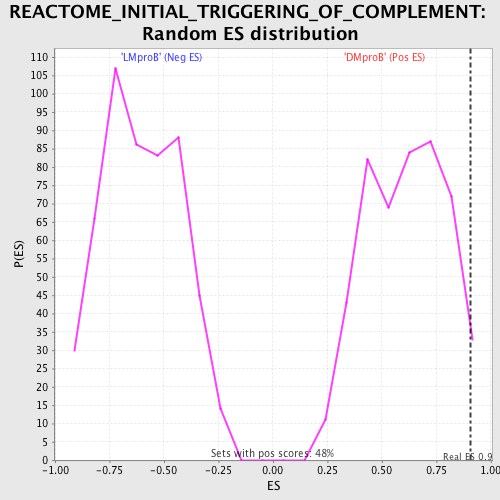
| GeneSet | REACTOME_INITIAL_TRIGGERING_OF_COMPLEMENT |
| Enrichment Score (ES) | 0.90908957 |
| Normalized Enrichment Score (NES) | 1.4864451 |
| Nominal p-value | 0.024948025 |
| FDR q-value | 0.6921043 |
| FWER p-Value | 1.0 |
| PROBE | DESCRIPTION (from dataset) | GENE SYMBOL | GENE_TITLE | RANK IN GENE LIST | RANK METRIC SCORE | RUNNING ES | CORE ENRICHMENT | |
|---|---|---|---|---|---|---|---|---|
| 1 | C3 | 22915 | 43 | 1.780 | 0.9091 | Yes | ||
| 2 | C1QB | 8667 | 1672 | 0.095 | 0.8702 | No | ||
| 3 | C1QC | 15706 | 3147 | 0.029 | 0.8056 | No | ||
| 4 | C2 | 23013 | 4215 | 0.014 | 0.7556 | No | ||
| 5 | C1R | 11942 6951 6952 | 7916 | 0.002 | 0.5577 | No | ||
| 6 | CFD | 19957 | 8368 | 0.001 | 0.5340 | No | ||
| 7 | C1S | 6950 6949 | 9942 | -0.002 | 0.4503 | No | ||
| 8 | C1QA | 8666 | 13039 | -0.009 | 0.2883 | No | ||
| 9 | MASP1 | 1632 22626 | 13328 | -0.010 | 0.2779 | No | ||
| 10 | MBL2 | 23886 | 13768 | -0.012 | 0.2605 | No |