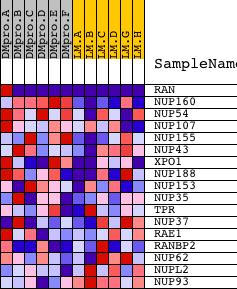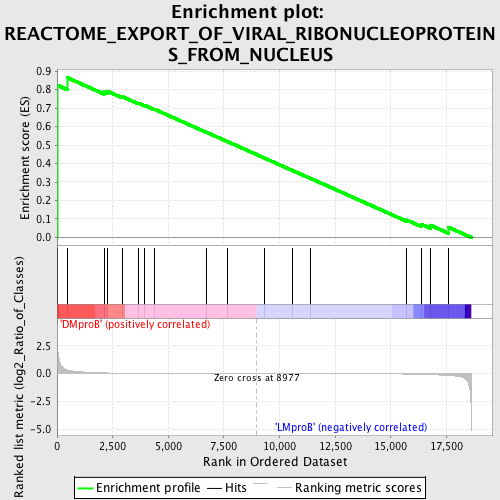
Profile of the Running ES Score & Positions of GeneSet Members on the Rank Ordered List
| Dataset | Set_04_DMproB_versus_LMproB.phenotype_DMproB_versus_LMproB.cls #DMproB_versus_LMproB |
| Phenotype | phenotype_DMproB_versus_LMproB.cls#DMproB_versus_LMproB |
| Upregulated in class | DMproB |
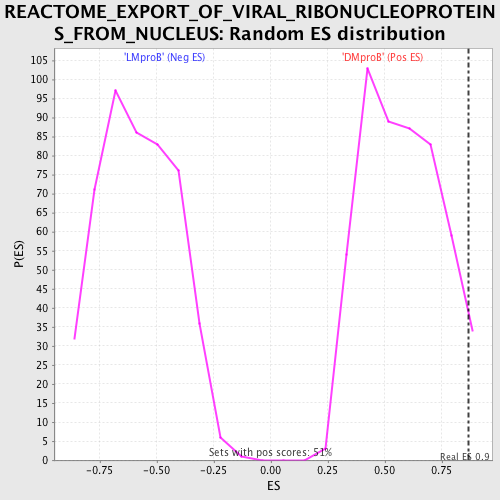
| GeneSet | REACTOME_EXPORT_OF_VIRAL_RIBONUCLEOPROTEINS_FROM_NUCLEUS |
| Enrichment Score (ES) | 0.8648992 |
| Normalized Enrichment Score (NES) | 1.5043157 |
| Nominal p-value | 0.033203125 |
| FDR q-value | 0.8091437 |
| FWER p-Value | 1.0 |
| PROBE | DESCRIPTION (from dataset) | GENE SYMBOL | GENE_TITLE | RANK IN GENE LIST | RANK METRIC SCORE | RUNNING ES | CORE ENRICHMENT | |
|---|---|---|---|---|---|---|---|---|
| 1 | RAN | 5356 9691 | 1 | 4.293 | 0.8243 | Yes | ||
| 2 | NUP160 | 14957 | 452 | 0.338 | 0.8649 | Yes | ||
| 3 | NUP54 | 11231 11232 6516 | 2108 | 0.065 | 0.7884 | No | ||
| 4 | NUP107 | 8337 | 2268 | 0.057 | 0.7909 | No | ||
| 5 | NUP155 | 2298 5027 | 2941 | 0.033 | 0.7611 | No | ||
| 6 | NUP43 | 20094 | 3666 | 0.020 | 0.7260 | No | ||
| 7 | XPO1 | 4172 | 3943 | 0.017 | 0.7144 | No | ||
| 8 | NUP188 | 15053 | 4393 | 0.013 | 0.6927 | No | ||
| 9 | NUP153 | 21474 | 6707 | 0.004 | 0.5692 | No | ||
| 10 | NUP35 | 12803 | 7643 | 0.002 | 0.5194 | No | ||
| 11 | TPR | 927 4255 | 9304 | -0.001 | 0.4303 | No | ||
| 12 | NUP37 | 3294 3326 19909 | 10561 | -0.003 | 0.3633 | No | ||
| 13 | RAE1 | 12395 | 11382 | -0.004 | 0.3200 | No | ||
| 14 | RANBP2 | 20019 | 15709 | -0.037 | 0.0946 | No | ||
| 15 | NUP62 | 9497 | 16359 | -0.063 | 0.0718 | No | ||
| 16 | NUPL2 | 6072 | 16784 | -0.089 | 0.0660 | No | ||
| 17 | NUP93 | 7762 | 17605 | -0.169 | 0.0544 | No |