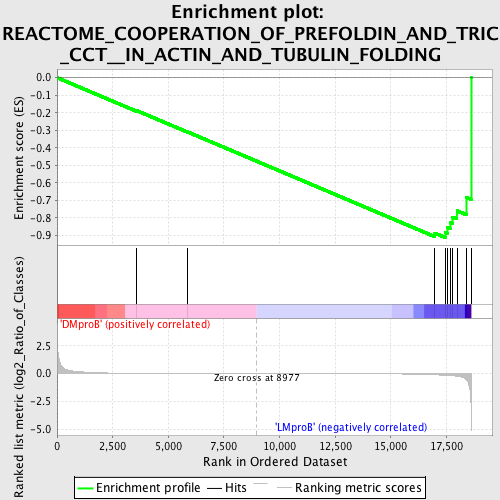
Profile of the Running ES Score & Positions of GeneSet Members on the Rank Ordered List
| Dataset | Set_04_DMproB_versus_LMproB.phenotype_DMproB_versus_LMproB.cls #DMproB_versus_LMproB |
| Phenotype | phenotype_DMproB_versus_LMproB.cls#DMproB_versus_LMproB |
| Upregulated in class | LMproB |
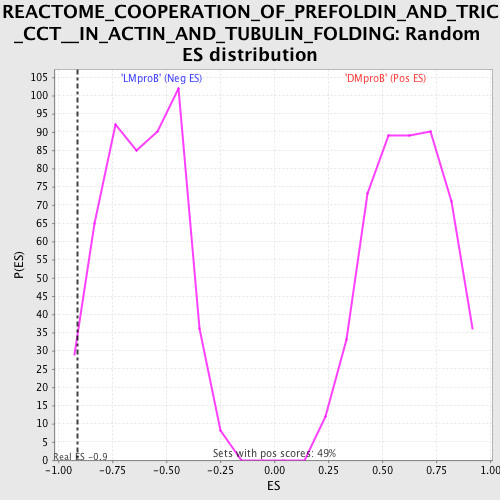
| GeneSet | REACTOME_COOPERATION_OF_PREFOLDIN_AND_TRIC_CCT__IN_ACTIN_AND_TUBULIN_FOLDING |
| Enrichment Score (ES) | -0.9111187 |
| Normalized Enrichment Score (NES) | -1.4890429 |
| Nominal p-value | 0.015779093 |
| FDR q-value | 0.67443997 |
| FWER p-Value | 1.0 |
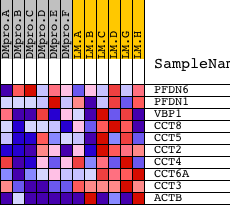
| PROBE | DESCRIPTION (from dataset) | GENE SYMBOL | GENE_TITLE | RANK IN GENE LIST | RANK METRIC SCORE | RUNNING ES | CORE ENRICHMENT | |
|---|---|---|---|---|---|---|---|---|
| 1 | PFDN6 | 23025 | 3550 | 0.021 | -0.1865 | No | ||
| 2 | PFDN1 | 23458 | 5850 | 0.007 | -0.3087 | No | ||
| 3 | VBP1 | 10281 | 16980 | -0.103 | -0.8864 | Yes | ||
| 4 | CCT8 | 22551 | 17441 | -0.147 | -0.8818 | Yes | ||
| 5 | CCT5 | 22316 | 17537 | -0.160 | -0.8550 | Yes | ||
| 6 | CCT2 | 19622 | 17664 | -0.176 | -0.8267 | Yes | ||
| 7 | CCT4 | 8710 | 17774 | -0.191 | -0.7945 | Yes | ||
| 8 | CCT6A | 16689 | 17974 | -0.232 | -0.7590 | Yes | ||
| 9 | CCT3 | 8709 | 18387 | -0.494 | -0.6826 | Yes | ||
| 10 | ACTB | 8534 337 337 338 | 18610 | -3.484 | 0.0003 | Yes |