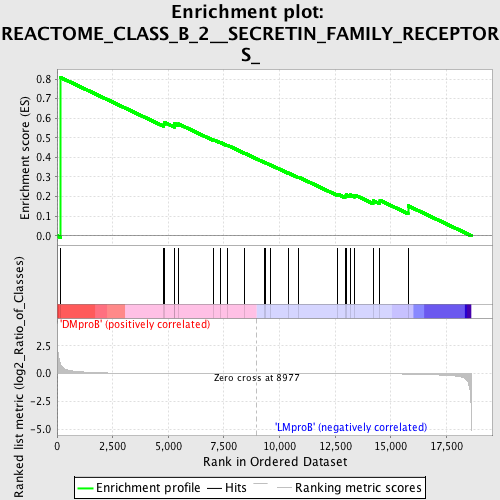
Profile of the Running ES Score & Positions of GeneSet Members on the Rank Ordered List
| Dataset | Set_04_DMproB_versus_LMproB.phenotype_DMproB_versus_LMproB.cls #DMproB_versus_LMproB |
| Phenotype | phenotype_DMproB_versus_LMproB.cls#DMproB_versus_LMproB |
| Upregulated in class | DMproB |
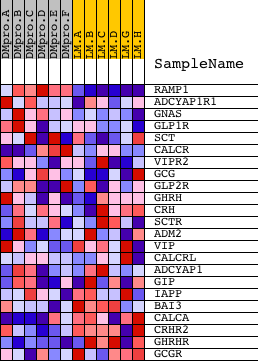
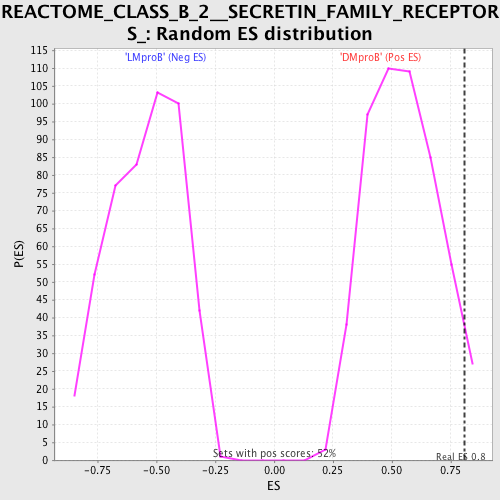
| GeneSet | REACTOME_CLASS_B_2__SECRETIN_FAMILY_RECEPTORS_ |
| Enrichment Score (ES) | 0.80776674 |
| Normalized Enrichment Score (NES) | 1.4761949 |
| Nominal p-value | 0.041984733 |
| FDR q-value | 0.697488 |
| FWER p-Value | 1.0 |
| PROBE | DESCRIPTION (from dataset) | GENE SYMBOL | GENE_TITLE | RANK IN GENE LIST | RANK METRIC SCORE | RUNNING ES | CORE ENRICHMENT | |
|---|---|---|---|---|---|---|---|---|
| 1 | RAMP1 | 14189 | 164 | 0.799 | 0.8078 | Yes | ||
| 2 | ADCYAP1R1 | 8553 1192 4349 | 4799 | 0.011 | 0.5694 | No | ||
| 3 | GNAS | 9025 2963 2752 | 4813 | 0.011 | 0.5796 | No | ||
| 4 | GLP1R | 23304 | 5271 | 0.009 | 0.5638 | No | ||
| 5 | SCT | 17560 | 5285 | 0.009 | 0.5720 | No | ||
| 6 | CALCR | 17229 | 5455 | 0.008 | 0.5710 | No | ||
| 7 | VIPR2 | 21125 | 7046 | 0.004 | 0.4892 | No | ||
| 8 | GCG | 14578 | 7326 | 0.003 | 0.4773 | No | ||
| 9 | GLP2R | 8227 13563 13564 | 7657 | 0.002 | 0.4620 | No | ||
| 10 | GHRH | 14372 | 8435 | 0.001 | 0.4211 | No | ||
| 11 | CRH | 8784 | 9300 | -0.001 | 0.3753 | No | ||
| 12 | SCTR | 14157 | 9359 | -0.001 | 0.3729 | No | ||
| 13 | ADM2 | 22388 | 9613 | -0.001 | 0.3603 | No | ||
| 14 | VIP | 20096 | 10397 | -0.002 | 0.3206 | No | ||
| 15 | CALCRL | 12041 | 10853 | -0.003 | 0.2994 | No | ||
| 16 | ADCYAP1 | 4348 | 12612 | -0.007 | 0.2123 | No | ||
| 17 | GIP | 76 | 12943 | -0.008 | 0.2031 | No | ||
| 18 | IAPP | 17249 | 13000 | -0.009 | 0.2088 | No | ||
| 19 | BAI3 | 5580 | 13179 | -0.009 | 0.2086 | No | ||
| 20 | CALCA | 4470 | 13383 | -0.010 | 0.2080 | No | ||
| 21 | CRHR2 | 17140 | 14201 | -0.015 | 0.1793 | No | ||
| 22 | GHRHR | 1007 17436 | 14511 | -0.018 | 0.1806 | No | ||
| 23 | GCGR | 20566 | 15778 | -0.039 | 0.1526 | No |