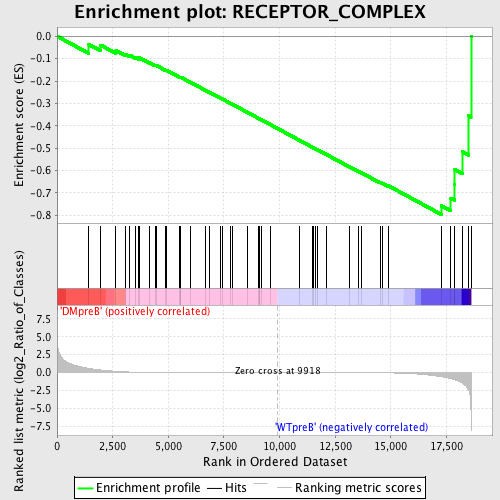
Profile of the Running ES Score & Positions of GeneSet Members on the Rank Ordered List
| Dataset | Set_04_DMpreB_versus_WTpreB.phenotype_DMpreB_versus_WTpreB.cls #DMpreB_versus_WTpreB |
| Phenotype | phenotype_DMpreB_versus_WTpreB.cls#DMpreB_versus_WTpreB |
| Upregulated in class | WTpreB |
| GeneSet | RECEPTOR_COMPLEX |
| Enrichment Score (ES) | -0.79619634 |
| Normalized Enrichment Score (NES) | -1.6330206 |
| Nominal p-value | 0.0041753654 |
| FDR q-value | 0.11082 |
| FWER p-Value | 0.274 |
| PROBE | DESCRIPTION (from dataset) | GENE SYMBOL | GENE_TITLE | RANK IN GENE LIST | RANK METRIC SCORE | RUNNING ES | CORE ENRICHMENT | |
|---|---|---|---|---|---|---|---|---|
| 1 | ITGB7 | 22112 | 1427 | 0.577 | -0.0368 | No | ||
| 2 | SMAD3 | 19084 | 1947 | 0.370 | -0.0390 | No | ||
| 3 | SRPR | 12525 7433 | 2644 | 0.180 | -0.0640 | No | ||
| 4 | ITGB3 | 20631 | 3085 | 0.098 | -0.0809 | No | ||
| 5 | ITGA9 | 19280 | 3248 | 0.082 | -0.0839 | No | ||
| 6 | ACVR1 | 4334 | 3517 | 0.062 | -0.0941 | No | ||
| 7 | ITGB4 | 9669 159 | 3673 | 0.054 | -0.0987 | No | ||
| 8 | SRP9 | 11297 14019 | 3682 | 0.053 | -0.0954 | No | ||
| 9 | IL6R | 1862 4919 | 4135 | 0.037 | -0.1172 | No | ||
| 10 | CHRNA2 | 21978 | 4422 | 0.030 | -0.1305 | No | ||
| 11 | CHRNE | 20368 | 4451 | 0.029 | -0.1300 | No | ||
| 12 | ITGA10 | 15493 | 4876 | 0.022 | -0.1513 | No | ||
| 13 | GRIN1 | 9041 4804 | 4919 | 0.022 | -0.1520 | No | ||
| 14 | CHRNA4 | 8531 4320 | 5508 | 0.016 | -0.1826 | No | ||
| 15 | TGFBR2 | 2994 3001 10167 | 5531 | 0.016 | -0.1827 | No | ||
| 16 | CHRNB2 | 8532 4321 | 5548 | 0.016 | -0.1825 | No | ||
| 17 | ITGAE | 20791 1481 1397 1380 1278 1238 1359 | 6001 | 0.012 | -0.2059 | No | ||
| 18 | ITGB6 | 14581 2809 | 6675 | 0.009 | -0.2415 | No | ||
| 19 | CHRNA1 | 4319 14559 8530 | 6843 | 0.008 | -0.2499 | No | ||
| 20 | ITGA8 | 14685 | 7355 | 0.007 | -0.2770 | No | ||
| 21 | ITGA11 | 6677 11449 | 7452 | 0.006 | -0.2817 | No | ||
| 22 | OSMR | 22333 | 7780 | 0.005 | -0.2990 | No | ||
| 23 | ADRB3 | 18901 | 7884 | 0.005 | -0.3042 | No | ||
| 24 | ITGA3 | 20284 | 8555 | 0.003 | -0.3401 | No | ||
| 25 | CD247 | 4498 8715 | 9037 | 0.002 | -0.3658 | No | ||
| 26 | TRIP6 | 16331 | 9107 | 0.002 | -0.3694 | No | ||
| 27 | CHRNB4 | 19107 | 9114 | 0.002 | -0.3696 | No | ||
| 28 | IL28RA | 10823 16038 | 9193 | 0.002 | -0.3737 | No | ||
| 29 | CHRNA7 | 17808 | 9599 | 0.001 | -0.3954 | No | ||
| 30 | CHRNA3 | 4291 | 10894 | -0.002 | -0.4649 | No | ||
| 31 | ITGAX | 18058 | 11470 | -0.004 | -0.4956 | No | ||
| 32 | CHRND | 3931 4084 | 11542 | -0.004 | -0.4992 | No | ||
| 33 | IL13RA1 | 24361 | 11611 | -0.004 | -0.5025 | No | ||
| 34 | ACVR1C | 14585 | 11711 | -0.005 | -0.5075 | No | ||
| 35 | CHRNA6 | 18900 | 12105 | -0.006 | -0.5283 | No | ||
| 36 | ITGAM | 9188 | 13155 | -0.011 | -0.5840 | No | ||
| 37 | BMPR1B | 8661 15152 4451 | 13546 | -0.014 | -0.6040 | No | ||
| 38 | ITGA5 | 22105 | 13669 | -0.015 | -0.6096 | No | ||
| 39 | ZAP70 | 14271 4042 | 14520 | -0.029 | -0.6533 | No | ||
| 40 | TGFBR1 | 16213 10165 5745 | 14629 | -0.032 | -0.6569 | No | ||
| 41 | CHRNB3 | 18642 44 3879 | 14878 | -0.041 | -0.6674 | No | ||
| 42 | CARD11 | 8436 | 17271 | -0.561 | -0.7573 | Yes | ||
| 43 | ADRB2 | 23422 | 17695 | -0.828 | -0.7226 | Yes | ||
| 44 | SYK | 21636 | 17870 | -0.978 | -0.6641 | Yes | ||
| 45 | BCL10 | 15397 | 17878 | -0.984 | -0.5962 | Yes | ||
| 46 | CD79A | 18342 | 18218 | -1.423 | -0.5156 | Yes | ||
| 47 | SDCBP | 2339 6998 6999 | 18503 | -2.526 | -0.3556 | Yes | ||
| 48 | MYH9 | 2252 2244 | 18604 | -5.210 | 0.0006 | Yes |

