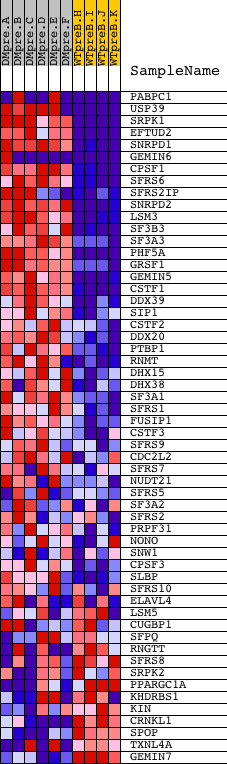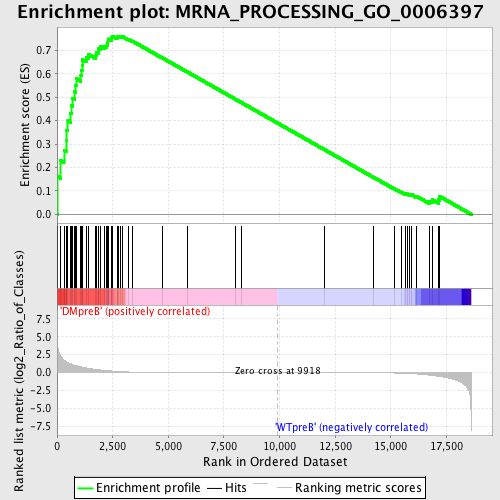
Profile of the Running ES Score & Positions of GeneSet Members on the Rank Ordered List
| Dataset | Set_04_DMpreB_versus_WTpreB.phenotype_DMpreB_versus_WTpreB.cls #DMpreB_versus_WTpreB |
| Phenotype | phenotype_DMpreB_versus_WTpreB.cls#DMpreB_versus_WTpreB |
| Upregulated in class | DMpreB |
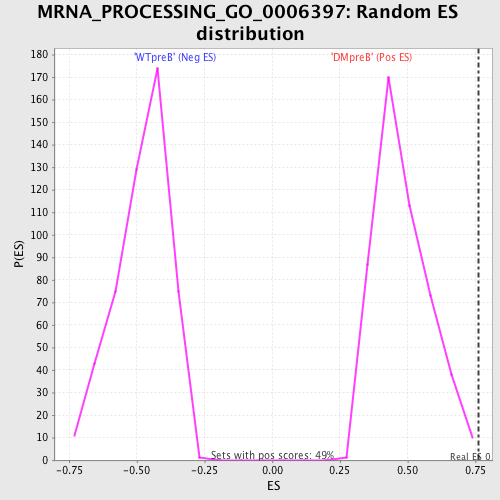
| GeneSet | MRNA_PROCESSING_GO_0006397 |
| Enrichment Score (ES) | 0.76105946 |
| Normalized Enrichment Score (NES) | 1.5818431 |
| Nominal p-value | 0.0020325202 |
| FDR q-value | 0.06440404 |
| FWER p-Value | 0.516 |
| PROBE | DESCRIPTION (from dataset) | GENE SYMBOL | GENE_TITLE | RANK IN GENE LIST | RANK METRIC SCORE | RUNNING ES | CORE ENRICHMENT | |
|---|---|---|---|---|---|---|---|---|
| 1 | PABPC1 | 5219 9522 9523 23572 | 7 | 5.273 | 0.1620 | Yes | ||
| 2 | USP39 | 1116 1083 11373 | 147 | 2.443 | 0.2298 | Yes | ||
| 3 | SRPK1 | 23049 | 310 | 1.742 | 0.2747 | Yes | ||
| 4 | EFTUD2 | 1219 20203 | 431 | 1.483 | 0.3139 | Yes | ||
| 5 | SNRPD1 | 23622 | 435 | 1.475 | 0.3592 | Yes | ||
| 6 | GEMIN6 | 12492 7415 | 487 | 1.391 | 0.3993 | Yes | ||
| 7 | CPSF1 | 22241 | 606 | 1.230 | 0.4308 | Yes | ||
| 8 | SFRS6 | 14751 | 645 | 1.178 | 0.4650 | Yes | ||
| 9 | SFRS2IP | 7794 13009 | 699 | 1.114 | 0.4965 | Yes | ||
| 10 | SNRPD2 | 8412 | 784 | 1.029 | 0.5236 | Yes | ||
| 11 | LSM3 | 12565 | 827 | 0.998 | 0.5521 | Yes | ||
| 12 | SF3B3 | 18746 | 858 | 0.955 | 0.5799 | Yes | ||
| 13 | SF3A3 | 16091 | 1070 | 0.793 | 0.5930 | Yes | ||
| 14 | PHF5A | 22194 | 1098 | 0.775 | 0.6154 | Yes | ||
| 15 | GRSF1 | 16487 | 1122 | 0.759 | 0.6375 | Yes | ||
| 16 | GEMIN5 | 20439 | 1141 | 0.746 | 0.6595 | Yes | ||
| 17 | CSTF1 | 12515 | 1305 | 0.641 | 0.6705 | Yes | ||
| 18 | DDX39 | 18551 | 1399 | 0.591 | 0.6837 | Yes | ||
| 19 | SIP1 | 21263 | 1744 | 0.440 | 0.6787 | Yes | ||
| 20 | CSTF2 | 24257 | 1764 | 0.432 | 0.6910 | Yes | ||
| 21 | DDX20 | 15213 | 1844 | 0.403 | 0.6992 | Yes | ||
| 22 | PTBP1 | 5303 | 1875 | 0.392 | 0.7096 | Yes | ||
| 23 | RNMT | 7501 | 1964 | 0.365 | 0.7161 | Yes | ||
| 24 | DHX15 | 8842 | 2119 | 0.313 | 0.7175 | Yes | ||
| 25 | DHX38 | 48 | 2236 | 0.279 | 0.7198 | Yes | ||
| 26 | SF3A1 | 7450 | 2253 | 0.275 | 0.7274 | Yes | ||
| 27 | SFRS1 | 8492 | 2269 | 0.270 | 0.7349 | Yes | ||
| 28 | FUSIP1 | 4715 16036 | 2287 | 0.266 | 0.7422 | Yes | ||
| 29 | CSTF3 | 10449 6002 | 2313 | 0.259 | 0.7488 | Yes | ||
| 30 | SFRS9 | 16731 | 2448 | 0.225 | 0.7485 | Yes | ||
| 31 | CDC2L2 | 15964 2419 | 2459 | 0.222 | 0.7548 | Yes | ||
| 32 | SFRS7 | 22889 | 2474 | 0.218 | 0.7607 | Yes | ||
| 33 | NUDT21 | 12665 | 2696 | 0.167 | 0.7540 | Yes | ||
| 34 | SFRS5 | 9808 2062 | 2710 | 0.165 | 0.7583 | Yes | ||
| 35 | SF3A2 | 19938 | 2749 | 0.155 | 0.7611 | Yes | ||
| 36 | SFRS2 | 9807 20136 | 2845 | 0.136 | 0.7601 | No | ||
| 37 | PRPF31 | 7594 | 2923 | 0.123 | 0.7598 | No | ||
| 38 | NONO | 11993 | 3209 | 0.085 | 0.7470 | No | ||
| 39 | SNW1 | 7282 | 3405 | 0.068 | 0.7386 | No | ||
| 40 | CPSF3 | 7038 | 4738 | 0.024 | 0.6676 | No | ||
| 41 | SLBP | 9822 | 5863 | 0.013 | 0.6074 | No | ||
| 42 | SFRS10 | 9818 1722 5441 | 8003 | 0.005 | 0.4923 | No | ||
| 43 | ELAVL4 | 15805 4889 9137 | 8277 | 0.004 | 0.4777 | No | ||
| 44 | LSM5 | 7286 | 12026 | -0.006 | 0.2760 | No | ||
| 45 | CUGBP1 | 2805 8819 4576 2924 | 14212 | -0.023 | 0.1590 | No | ||
| 46 | SFPQ | 12936 | 15172 | -0.054 | 0.1090 | No | ||
| 47 | RNGTT | 10769 2354 6272 | 15467 | -0.074 | 0.0954 | No | ||
| 48 | SFRS8 | 10543 6089 | 15641 | -0.090 | 0.0889 | No | ||
| 49 | SRPK2 | 5513 | 15728 | -0.101 | 0.0874 | No | ||
| 50 | PPARGC1A | 16533 | 15834 | -0.119 | 0.0854 | No | ||
| 51 | KHDRBS1 | 5405 9778 | 15928 | -0.131 | 0.0844 | No | ||
| 52 | KIN | 15120 | 16140 | -0.177 | 0.0785 | No | ||
| 53 | CRNKL1 | 14407 | 16745 | -0.354 | 0.0568 | No | ||
| 54 | SPOP | 5498 | 16868 | -0.393 | 0.0624 | No | ||
| 55 | TXNL4A | 6567 11329 | 17135 | -0.504 | 0.0635 | No | ||
| 56 | GEMIN7 | 17944 | 17201 | -0.526 | 0.0762 | No |