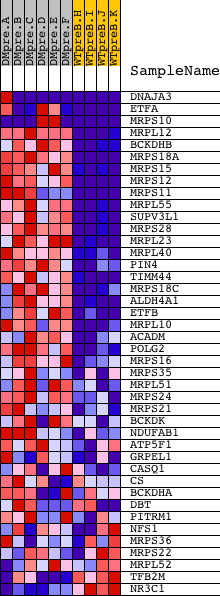
Profile of the Running ES Score & Positions of GeneSet Members on the Rank Ordered List
| Dataset | Set_04_DMpreB_versus_WTpreB.phenotype_DMpreB_versus_WTpreB.cls #DMpreB_versus_WTpreB |
| Phenotype | phenotype_DMpreB_versus_WTpreB.cls#DMpreB_versus_WTpreB |
| Upregulated in class | DMpreB |
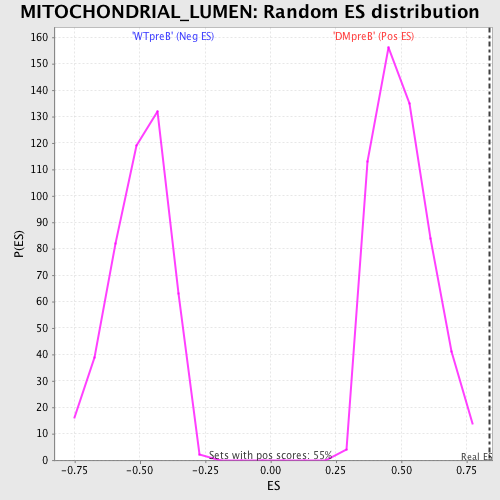
| GeneSet | MITOCHONDRIAL_LUMEN |
| Enrichment Score (ES) | 0.83625066 |
| Normalized Enrichment Score (NES) | 1.6627709 |
| Nominal p-value | 0.0 |
| FDR q-value | 0.039201096 |
| FWER p-Value | 0.077 |
| PROBE | DESCRIPTION (from dataset) | GENE SYMBOL | GENE_TITLE | RANK IN GENE LIST | RANK METRIC SCORE | RUNNING ES | CORE ENRICHMENT | |
|---|---|---|---|---|---|---|---|---|
| 1 | DNAJA3 | 1732 13518 | 34 | 3.649 | 0.1231 | Yes | ||
| 2 | ETFA | 4292 8495 3155 | 130 | 2.518 | 0.2042 | Yes | ||
| 3 | MRPS10 | 7229 12261 23212 | 238 | 2.013 | 0.2673 | Yes | ||
| 4 | MRPL12 | 12090 | 340 | 1.673 | 0.3192 | Yes | ||
| 5 | BCKDHB | 19365 | 397 | 1.551 | 0.3692 | Yes | ||
| 6 | MRPS18A | 23222 | 499 | 1.378 | 0.4110 | Yes | ||
| 7 | MRPS15 | 2442 12345 | 530 | 1.341 | 0.4553 | Yes | ||
| 8 | MRPS12 | 17907 6273 | 544 | 1.322 | 0.4998 | Yes | ||
| 9 | MRPS11 | 12621 3150 | 546 | 1.318 | 0.5449 | Yes | ||
| 10 | MRPL55 | 20864 | 548 | 1.318 | 0.5900 | Yes | ||
| 11 | SUPV3L1 | 11677 | 564 | 1.299 | 0.6336 | Yes | ||
| 12 | MRPS28 | 15377 | 866 | 0.951 | 0.6500 | Yes | ||
| 13 | MRPL23 | 9738 | 924 | 0.902 | 0.6778 | Yes | ||
| 14 | MRPL40 | 22641 | 1084 | 0.785 | 0.6961 | Yes | ||
| 15 | PIN4 | 12817 | 1137 | 0.752 | 0.7190 | Yes | ||
| 16 | TIMM44 | 3858 18941 | 1156 | 0.738 | 0.7433 | Yes | ||
| 17 | MRPS18C | 12728 | 1185 | 0.720 | 0.7665 | Yes | ||
| 18 | ALDH4A1 | 16011 | 1312 | 0.637 | 0.7815 | Yes | ||
| 19 | ETFB | 18279 | 1342 | 0.621 | 0.8012 | Yes | ||
| 20 | MRPL10 | 20681 | 1785 | 0.425 | 0.7919 | Yes | ||
| 21 | ACADM | 15133 1800 | 1924 | 0.377 | 0.7974 | Yes | ||
| 22 | POLG2 | 20180 | 1935 | 0.373 | 0.8096 | Yes | ||
| 23 | MRPS16 | 12311 | 2034 | 0.343 | 0.8161 | Yes | ||
| 24 | MRPS35 | 17237 1068 | 2193 | 0.293 | 0.8176 | Yes | ||
| 25 | MRPL51 | 12361 7301 | 2215 | 0.287 | 0.8263 | Yes | ||
| 26 | MRPS24 | 12262 | 2319 | 0.257 | 0.8296 | Yes | ||
| 27 | MRPS21 | 12323 | 2507 | 0.211 | 0.8267 | Yes | ||
| 28 | BCKDK | 18061 1391 | 2514 | 0.209 | 0.8335 | Yes | ||
| 29 | NDUFAB1 | 7667 | 2610 | 0.189 | 0.8349 | Yes | ||
| 30 | ATP5F1 | 15212 | 2692 | 0.168 | 0.8363 | Yes | ||
| 31 | GRPEL1 | 16863 | 3064 | 0.101 | 0.8197 | No | ||
| 32 | CASQ1 | 13752 8695 | 4230 | 0.034 | 0.7582 | No | ||
| 33 | CS | 19839 | 4292 | 0.033 | 0.7560 | No | ||
| 34 | BCKDHA | 17925 | 4307 | 0.032 | 0.7564 | No | ||
| 35 | DBT | 1770 4599 | 5481 | 0.016 | 0.6938 | No | ||
| 36 | PITRM1 | 21710 | 5611 | 0.015 | 0.6874 | No | ||
| 37 | NFS1 | 2903 14377 | 9077 | 0.002 | 0.5009 | No | ||
| 38 | MRPS36 | 7257 | 10664 | -0.002 | 0.4156 | No | ||
| 39 | MRPS22 | 19031 | 11280 | -0.003 | 0.3826 | No | ||
| 40 | MRPL52 | 22019 | 15743 | -0.102 | 0.1459 | No | ||
| 41 | TFB2M | 4024 9092 4083 | 15864 | -0.123 | 0.1436 | No | ||
| 42 | NR3C1 | 9043 | 15930 | -0.131 | 0.1446 | No |