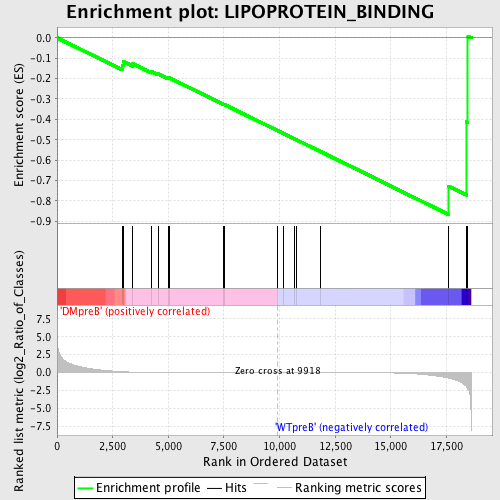
Profile of the Running ES Score & Positions of GeneSet Members on the Rank Ordered List
| Dataset | Set_04_DMpreB_versus_WTpreB.phenotype_DMpreB_versus_WTpreB.cls #DMpreB_versus_WTpreB |
| Phenotype | phenotype_DMpreB_versus_WTpreB.cls#DMpreB_versus_WTpreB |
| Upregulated in class | WTpreB |
| GeneSet | LIPOPROTEIN_BINDING |
| Enrichment Score (ES) | -0.8662193 |
| Normalized Enrichment Score (NES) | -1.4644798 |
| Nominal p-value | 0.019067796 |
| FDR q-value | 0.50777185 |
| FWER p-Value | 1.0 |
| PROBE | DESCRIPTION (from dataset) | GENE SYMBOL | GENE_TITLE | RANK IN GENE LIST | RANK METRIC SCORE | RUNNING ES | CORE ENRICHMENT | |
|---|---|---|---|---|---|---|---|---|
| 1 | LRP6 | 9286 | 2935 | 0.121 | -0.1354 | No | ||
| 2 | MAPT | 9420 1347 | 2993 | 0.112 | -0.1178 | No | ||
| 3 | LDLR | 4990 | 3403 | 0.068 | -0.1272 | No | ||
| 4 | CDH13 | 4506 3826 | 4251 | 0.034 | -0.1665 | No | ||
| 5 | COLEC12 | 23624 8946 | 4545 | 0.027 | -0.1772 | No | ||
| 6 | APOL2 | 22229 | 5007 | 0.021 | -0.1982 | No | ||
| 7 | VLDLR | 5858 3763 912 3682 | 5053 | 0.020 | -0.1968 | No | ||
| 8 | CXCL16 | 7251 | 7497 | 0.006 | -0.3270 | No | ||
| 9 | STAB2 | 19656 | 7537 | 0.006 | -0.3280 | No | ||
| 10 | STAB1 | 21892 | 9894 | 0.000 | -0.4547 | No | ||
| 11 | ANKRA2 | 21578 | 10163 | -0.001 | -0.4690 | No | ||
| 12 | APOA4 | 4401 | 10647 | -0.002 | -0.4946 | No | ||
| 13 | APOB48R | 18081 | 10750 | -0.002 | -0.4997 | No | ||
| 14 | LRP1 | 9284 | 11848 | -0.005 | -0.5578 | No | ||
| 15 | LRPAP1 | 5005 | 17586 | -0.751 | -0.7274 | Yes | ||
| 16 | SORL1 | 5474 | 18399 | -1.941 | -0.4123 | Yes | ||
| 17 | TLR6 | 215 16528 | 18467 | -2.294 | 0.0080 | Yes |

