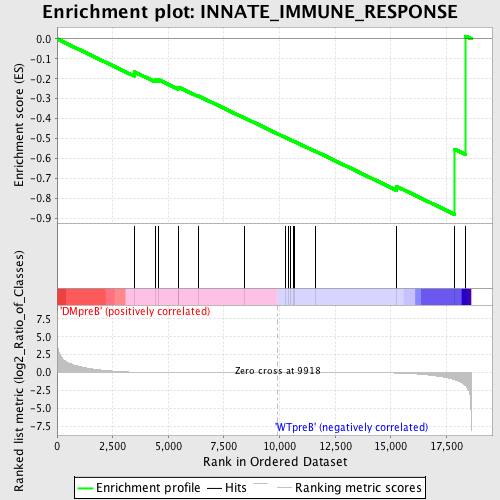
Profile of the Running ES Score & Positions of GeneSet Members on the Rank Ordered List
| Dataset | Set_04_DMpreB_versus_WTpreB.phenotype_DMpreB_versus_WTpreB.cls #DMpreB_versus_WTpreB |
| Phenotype | phenotype_DMpreB_versus_WTpreB.cls#DMpreB_versus_WTpreB |
| Upregulated in class | WTpreB |
| GeneSet | INNATE_IMMUNE_RESPONSE |
| Enrichment Score (ES) | -0.8810732 |
| Normalized Enrichment Score (NES) | -1.4783763 |
| Nominal p-value | 0.010683761 |
| FDR q-value | 0.4567648 |
| FWER p-Value | 0.998 |
| PROBE | DESCRIPTION (from dataset) | GENE SYMBOL | GENE_TITLE | RANK IN GENE LIST | RANK METRIC SCORE | RUNNING ES | CORE ENRICHMENT | |
|---|---|---|---|---|---|---|---|---|
| 1 | DMBT1 | 18050 | 3464 | 0.064 | -0.1648 | No | ||
| 2 | SFTPD | 21867 | 4407 | 0.030 | -0.2055 | No | ||
| 3 | COLEC12 | 23624 8946 | 4545 | 0.027 | -0.2037 | No | ||
| 4 | CRTAM | 19160 | 5441 | 0.017 | -0.2463 | No | ||
| 5 | MBL2 | 23886 | 5470 | 0.016 | -0.2424 | No | ||
| 6 | DEFB1 | 18663 | 6351 | 0.011 | -0.2862 | No | ||
| 7 | IFNK | 11837 | 8443 | 0.003 | -0.3975 | No | ||
| 8 | NCR1 | 18409 | 10245 | -0.001 | -0.4941 | No | ||
| 9 | TLR8 | 9308 | 10380 | -0.001 | -0.5009 | No | ||
| 10 | IL12B | 20918 | 10475 | -0.001 | -0.5055 | No | ||
| 11 | EREG | 4679 16797 | 10638 | -0.002 | -0.5137 | No | ||
| 12 | APOA4 | 4401 | 10647 | -0.002 | -0.5135 | No | ||
| 13 | CADM1 | 7057 | 11628 | -0.004 | -0.5648 | No | ||
| 14 | DEFB127 | 622 | 15247 | -0.059 | -0.7397 | Yes | ||
| 15 | BCL10 | 15397 | 17878 | -0.984 | -0.5537 | Yes | ||
| 16 | IL12A | 4913 | 18353 | -1.783 | 0.0141 | Yes |

