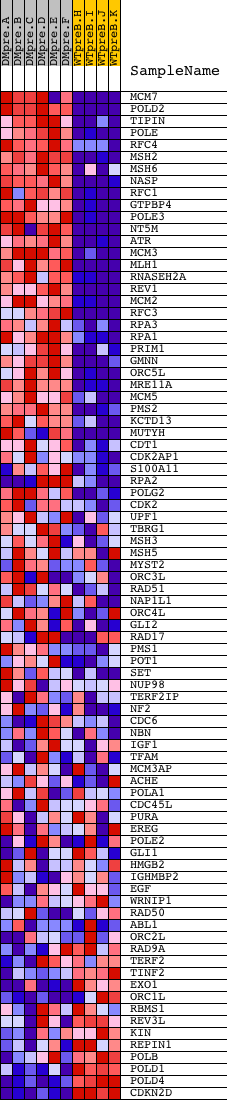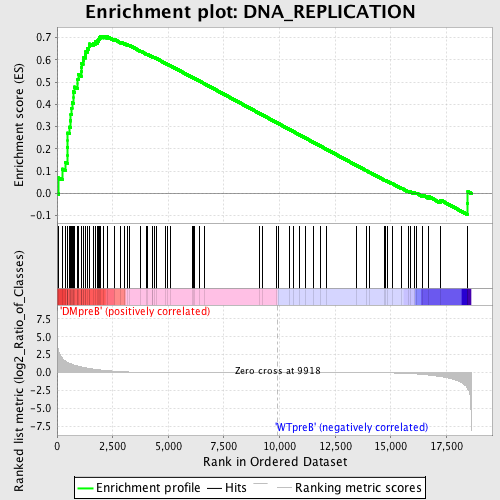
Profile of the Running ES Score & Positions of GeneSet Members on the Rank Ordered List
| Dataset | Set_04_DMpreB_versus_WTpreB.phenotype_DMpreB_versus_WTpreB.cls #DMpreB_versus_WTpreB |
| Phenotype | phenotype_DMpreB_versus_WTpreB.cls#DMpreB_versus_WTpreB |
| Upregulated in class | DMpreB |
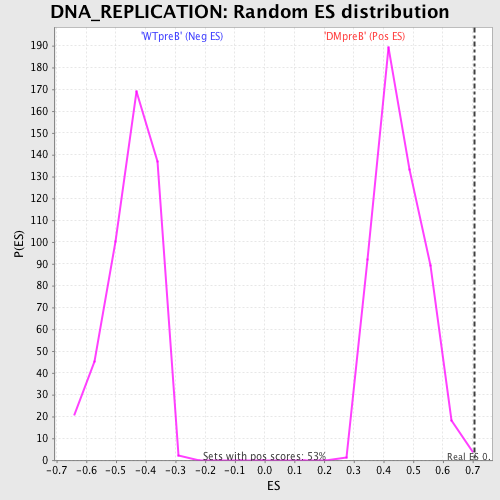
| GeneSet | DNA_REPLICATION |
| Enrichment Score (ES) | 0.7070764 |
| Normalized Enrichment Score (NES) | 1.5570059 |
| Nominal p-value | 0.0019011407 |
| FDR q-value | 0.066777706 |
| FWER p-Value | 0.733 |
| PROBE | DESCRIPTION (from dataset) | GENE SYMBOL | GENE_TITLE | RANK IN GENE LIST | RANK METRIC SCORE | RUNNING ES | CORE ENRICHMENT | |
|---|---|---|---|---|---|---|---|---|
| 1 | MCM7 | 9372 3568 | 61 | 3.035 | 0.0698 | Yes | ||
| 2 | POLD2 | 20537 | 230 | 2.045 | 0.1099 | Yes | ||
| 3 | TIPIN | 3013 7258 | 380 | 1.595 | 0.1403 | Yes | ||
| 4 | POLE | 16755 | 455 | 1.444 | 0.1711 | Yes | ||
| 5 | RFC4 | 1735 22627 | 460 | 1.437 | 0.2054 | Yes | ||
| 6 | MSH2 | 23138 | 480 | 1.403 | 0.2382 | Yes | ||
| 7 | MSH6 | 23137 5120 | 483 | 1.397 | 0.2717 | Yes | ||
| 8 | NASP | 2383 2387 6955 | 563 | 1.299 | 0.2987 | Yes | ||
| 9 | RFC1 | 16527 | 604 | 1.237 | 0.3263 | Yes | ||
| 10 | GTPBP4 | 21548 | 620 | 1.216 | 0.3548 | Yes | ||
| 11 | POLE3 | 7200 | 650 | 1.174 | 0.3815 | Yes | ||
| 12 | NT5M | 8345 4175 | 671 | 1.154 | 0.4082 | Yes | ||
| 13 | ATR | 19349 | 729 | 1.081 | 0.4311 | Yes | ||
| 14 | MCM3 | 13991 | 732 | 1.080 | 0.4570 | Yes | ||
| 15 | MLH1 | 18982 | 792 | 1.025 | 0.4785 | Yes | ||
| 16 | RNASEH2A | 12819 | 930 | 0.897 | 0.4927 | Yes | ||
| 17 | REV1 | 13971 | 931 | 0.896 | 0.5143 | Yes | ||
| 18 | MCM2 | 17074 | 956 | 0.874 | 0.5340 | Yes | ||
| 19 | RFC3 | 12786 | 1080 | 0.786 | 0.5463 | Yes | ||
| 20 | RPA3 | 12667 | 1090 | 0.781 | 0.5646 | Yes | ||
| 21 | RPA1 | 20349 | 1100 | 0.775 | 0.5828 | Yes | ||
| 22 | PRIM1 | 19847 | 1166 | 0.734 | 0.5970 | Yes | ||
| 23 | GMNN | 21513 | 1199 | 0.713 | 0.6124 | Yes | ||
| 24 | ORC5L | 11173 3595 | 1270 | 0.664 | 0.6246 | Yes | ||
| 25 | MRE11A | 3014 19560 | 1292 | 0.648 | 0.6391 | Yes | ||
| 26 | MCM5 | 18564 | 1363 | 0.612 | 0.6500 | Yes | ||
| 27 | PMS2 | 16632 | 1433 | 0.574 | 0.6601 | Yes | ||
| 28 | KCTD13 | 10609 | 1466 | 0.558 | 0.6718 | Yes | ||
| 29 | MUTYH | 2400 7693 | 1629 | 0.488 | 0.6748 | Yes | ||
| 30 | CDT1 | 18437 | 1711 | 0.452 | 0.6813 | Yes | ||
| 31 | CDK2AP1 | 8858 | 1819 | 0.413 | 0.6855 | Yes | ||
| 32 | S100A11 | 9771 | 1869 | 0.394 | 0.6923 | Yes | ||
| 33 | RPA2 | 2330 16057 | 1910 | 0.383 | 0.6994 | Yes | ||
| 34 | POLG2 | 20180 | 1935 | 0.373 | 0.7071 | Yes | ||
| 35 | CDK2 | 3438 3373 19592 3322 | 2093 | 0.323 | 0.7064 | No | ||
| 36 | UPF1 | 9718 18855 | 2259 | 0.274 | 0.7041 | No | ||
| 37 | TBRG1 | 3119 19174 | 2599 | 0.192 | 0.6904 | No | ||
| 38 | MSH3 | 5119 | 2868 | 0.133 | 0.6791 | No | ||
| 39 | MSH5 | 23010 1599 | 3034 | 0.104 | 0.6727 | No | ||
| 40 | MYST2 | 20283 | 3161 | 0.090 | 0.6681 | No | ||
| 41 | ORC3L | 6941 | 3258 | 0.081 | 0.6649 | No | ||
| 42 | RAD51 | 2897 14903 | 3745 | 0.050 | 0.6398 | No | ||
| 43 | NAP1L1 | 19882 3427 330 9485 5193 | 4026 | 0.040 | 0.6257 | No | ||
| 44 | ORC4L | 11172 6460 | 4060 | 0.039 | 0.6248 | No | ||
| 45 | GLI2 | 13859 | 4273 | 0.033 | 0.6142 | No | ||
| 46 | RAD17 | 21366 | 4304 | 0.033 | 0.6134 | No | ||
| 47 | PMS1 | 13958 | 4371 | 0.031 | 0.6105 | No | ||
| 48 | POT1 | 17201 | 4457 | 0.029 | 0.6067 | No | ||
| 49 | SET | 7070 | 4891 | 0.022 | 0.5838 | No | ||
| 50 | NUP98 | 17726 | 4981 | 0.021 | 0.5795 | No | ||
| 51 | TERF2IP | 12184 18463 7167 | 5093 | 0.020 | 0.5740 | No | ||
| 52 | NF2 | 1222 5166 | 6074 | 0.012 | 0.5214 | No | ||
| 53 | CDC6 | 6221 6220 | 6131 | 0.012 | 0.5187 | No | ||
| 54 | NBN | 2485 16268 2408 | 6169 | 0.011 | 0.5170 | No | ||
| 55 | IGF1 | 3352 9156 3409 | 6416 | 0.010 | 0.5040 | No | ||
| 56 | TFAM | 19739 3330 | 6622 | 0.009 | 0.4931 | No | ||
| 57 | MCM3AP | 19981 | 9080 | 0.002 | 0.3606 | No | ||
| 58 | ACHE | 16665 | 9221 | 0.002 | 0.3531 | No | ||
| 59 | POLA1 | 24112 | 9841 | 0.000 | 0.3197 | No | ||
| 60 | CDC45L | 22642 1752 | 9951 | -0.000 | 0.3138 | No | ||
| 61 | PURA | 9670 | 10425 | -0.001 | 0.2883 | No | ||
| 62 | EREG | 4679 16797 | 10638 | -0.002 | 0.2769 | No | ||
| 63 | POLE2 | 21053 | 10899 | -0.002 | 0.2629 | No | ||
| 64 | GLI1 | 19605 | 11157 | -0.003 | 0.2491 | No | ||
| 65 | HMGB2 | 13594 | 11501 | -0.004 | 0.2307 | No | ||
| 66 | IGHMBP2 | 23945 | 11839 | -0.005 | 0.2127 | No | ||
| 67 | EGF | 15169 | 12130 | -0.006 | 0.1972 | No | ||
| 68 | WRNIP1 | 21675 3161 | 13438 | -0.013 | 0.1270 | No | ||
| 69 | RAD50 | 1198 20460 | 13894 | -0.018 | 0.1028 | No | ||
| 70 | ABL1 | 2693 4301 2794 | 14038 | -0.020 | 0.0956 | No | ||
| 71 | ORC2L | 385 13949 | 14723 | -0.036 | 0.0595 | No | ||
| 72 | RAD9A | 913 3674 910 23958 | 14774 | -0.037 | 0.0577 | No | ||
| 73 | TERF2 | 18756 | 14866 | -0.041 | 0.0538 | No | ||
| 74 | TINF2 | 11381 | 15064 | -0.049 | 0.0444 | No | ||
| 75 | EXO1 | 14035 4135 | 15469 | -0.074 | 0.0244 | No | ||
| 76 | ORC1L | 327 16144 | 15780 | -0.109 | 0.0102 | No | ||
| 77 | RBMS1 | 14580 | 15872 | -0.124 | 0.0083 | No | ||
| 78 | REV3L | 20050 | 16044 | -0.156 | 0.0029 | No | ||
| 79 | KIN | 15120 | 16140 | -0.177 | 0.0020 | No | ||
| 80 | REPIN1 | 12220 | 16420 | -0.249 | -0.0071 | No | ||
| 81 | POLB | 9599 | 16694 | -0.338 | -0.0137 | No | ||
| 82 | POLD1 | 17847 | 17231 | -0.537 | -0.0297 | No | ||
| 83 | POLD4 | 12822 | 18434 | -2.084 | -0.0444 | No | ||
| 84 | CDKN2D | 19210 | 18464 | -2.248 | 0.0082 | No |