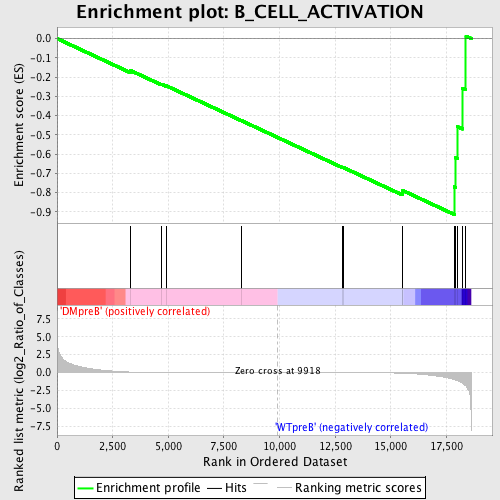
Profile of the Running ES Score & Positions of GeneSet Members on the Rank Ordered List
| Dataset | Set_04_DMpreB_versus_WTpreB.phenotype_DMpreB_versus_WTpreB.cls #DMpreB_versus_WTpreB |
| Phenotype | phenotype_DMpreB_versus_WTpreB.cls#DMpreB_versus_WTpreB |
| Upregulated in class | WTpreB |
| GeneSet | B_CELL_ACTIVATION |
| Enrichment Score (ES) | -0.91319865 |
| Normalized Enrichment Score (NES) | -1.480526 |
| Nominal p-value | 0.0060975607 |
| FDR q-value | 0.46821812 |
| FWER p-Value | 0.998 |
| PROBE | DESCRIPTION (from dataset) | GENE SYMBOL | GENE_TITLE | RANK IN GENE LIST | RANK METRIC SCORE | RUNNING ES | CORE ENRICHMENT | |
|---|---|---|---|---|---|---|---|---|
| 1 | TPD52 | 18830 5794 | 3296 | 0.077 | -0.1656 | No | ||
| 2 | TNFSF13 | 12806 | 4674 | 0.025 | -0.2358 | No | ||
| 3 | IL4 | 9174 | 4896 | 0.022 | -0.2444 | No | ||
| 4 | CD40LG | 24330 | 8298 | 0.004 | -0.4266 | No | ||
| 5 | IL7 | 4921 | 12843 | -0.009 | -0.6695 | No | ||
| 6 | INHA | 14214 | 12868 | -0.009 | -0.6694 | No | ||
| 7 | HDAC9 | 21084 2131 | 15520 | -0.080 | -0.7999 | Yes | ||
| 8 | PTPRC | 5327 9662 | 15526 | -0.080 | -0.7882 | Yes | ||
| 9 | HDAC5 | 1480 20205 | 17852 | -0.961 | -0.7694 | Yes | ||
| 10 | HDAC7A | 22147 | 17916 | -1.026 | -0.6194 | Yes | ||
| 11 | LAT2 | 16351 | 18003 | -1.110 | -0.4580 | Yes | ||
| 12 | CD79A | 18342 | 18218 | -1.423 | -0.2566 | Yes | ||
| 13 | TGFB1 | 18332 | 18378 | -1.858 | 0.0128 | Yes |

