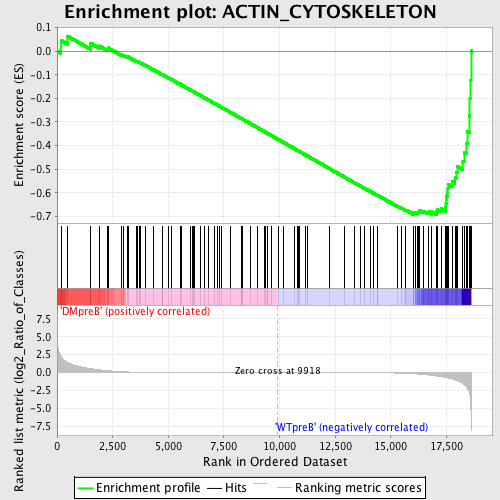
Profile of the Running ES Score & Positions of GeneSet Members on the Rank Ordered List
| Dataset | Set_04_DMpreB_versus_WTpreB.phenotype_DMpreB_versus_WTpreB.cls #DMpreB_versus_WTpreB |
| Phenotype | phenotype_DMpreB_versus_WTpreB.cls#DMpreB_versus_WTpreB |
| Upregulated in class | WTpreB |
| GeneSet | ACTIN_CYTOSKELETON |
| Enrichment Score (ES) | -0.6918209 |
| Normalized Enrichment Score (NES) | -1.579149 |
| Nominal p-value | 0.0 |
| FDR q-value | 0.2297334 |
| FWER p-Value | 0.671 |
| PROBE | DESCRIPTION (from dataset) | GENE SYMBOL | GENE_TITLE | RANK IN GENE LIST | RANK METRIC SCORE | RUNNING ES | CORE ENRICHMENT | |
|---|---|---|---|---|---|---|---|---|
| 1 | DCTN2 | 7635 12812 | 174 | 2.275 | 0.0454 | No | ||
| 2 | ANLN | 7581 3138 12730 | 469 | 1.413 | 0.0635 | No | ||
| 3 | KPTN | 18385 | 1492 | 0.548 | 0.0215 | No | ||
| 4 | CORO1C | 16425 | 1517 | 0.537 | 0.0331 | No | ||
| 5 | ARPC1A | 3541 16628 3519 | 1901 | 0.385 | 0.0217 | No | ||
| 6 | TPM3 | 12233 7209 7208 1790 | 2273 | 0.269 | 0.0081 | No | ||
| 7 | FLNB | 13742 | 2293 | 0.265 | 0.0135 | No | ||
| 8 | TNNI3 | 89 | 2872 | 0.132 | -0.0146 | No | ||
| 9 | VASP | 5847 | 2991 | 0.112 | -0.0183 | No | ||
| 10 | SMTN | 20551 1446 | 3160 | 0.090 | -0.0252 | No | ||
| 11 | TPM1 | 19070 | 3186 | 0.087 | -0.0244 | No | ||
| 12 | HAP1 | 1297 20231 1231 | 3574 | 0.059 | -0.0439 | No | ||
| 13 | BIN1 | 6634 2017 | 3598 | 0.058 | -0.0438 | No | ||
| 14 | SEPT9 | 20582 | 3717 | 0.051 | -0.0489 | No | ||
| 15 | DCTN3 | 15908 | 3768 | 0.049 | -0.0504 | No | ||
| 16 | AMPH | 3256 21700 | 3987 | 0.041 | -0.0612 | No | ||
| 17 | WASF1 | 13514 | 4334 | 0.032 | -0.0791 | No | ||
| 18 | ACTN2 | 21545 | 4737 | 0.024 | -0.1002 | No | ||
| 19 | ACTC1 | 14481 14482 | 4753 | 0.024 | -0.1005 | No | ||
| 20 | ACTR1B | 30 | 4994 | 0.021 | -0.1129 | No | ||
| 21 | MYH6 | 9436 | 5162 | 0.019 | -0.1215 | No | ||
| 22 | TPM2 | 2367 2437 | 5564 | 0.016 | -0.1428 | No | ||
| 23 | USH1G | 20153 | 5592 | 0.015 | -0.1439 | No | ||
| 24 | FSCN1 | 16637 | 5991 | 0.012 | -0.1650 | No | ||
| 25 | ACTL7B | 15880 | 6070 | 0.012 | -0.1690 | No | ||
| 26 | KLHL2 | 13381 | 6118 | 0.012 | -0.1712 | No | ||
| 27 | ESPN | 15656 | 6186 | 0.011 | -0.1746 | No | ||
| 28 | ARPC1B | 3512 8628 | 6429 | 0.010 | -0.1874 | No | ||
| 29 | ABLIM1 | 3717 3766 3679 | 6638 | 0.009 | -0.1984 | No | ||
| 30 | CAPZA2 | 8688 991 | 6797 | 0.009 | -0.2067 | No | ||
| 31 | ACTR3 | 13166 | 7080 | 0.008 | -0.2218 | No | ||
| 32 | MYL3 | 19291 | 7219 | 0.007 | -0.2290 | No | ||
| 33 | STK38L | 17240 | 7314 | 0.007 | -0.2340 | No | ||
| 34 | MYOT | 1979 23566 | 7383 | 0.006 | -0.2375 | No | ||
| 35 | MYH10 | 8077 | 7791 | 0.005 | -0.2593 | No | ||
| 36 | PKD2 | 16772 | 8291 | 0.004 | -0.2862 | No | ||
| 37 | AVIL | 19861 | 8306 | 0.004 | -0.2868 | No | ||
| 38 | MYL9 | 14767 2659 | 8354 | 0.004 | -0.2893 | No | ||
| 39 | MYO3A | 10065 | 8701 | 0.003 | -0.3079 | No | ||
| 40 | MYOM1 | 23165 | 9021 | 0.002 | -0.3251 | No | ||
| 41 | ACTA1 | 18715 | 9301 | 0.001 | -0.3401 | No | ||
| 42 | NEB | 5158 | 9346 | 0.001 | -0.3424 | No | ||
| 43 | CAPZA1 | 8687 | 9439 | 0.001 | -0.3474 | No | ||
| 44 | ACTR2 | 20523 | 9444 | 0.001 | -0.3476 | No | ||
| 45 | GYS2 | 16941 | 9648 | 0.001 | -0.3585 | No | ||
| 46 | TSC1 | 7235 | 9972 | -0.000 | -0.3760 | No | ||
| 47 | CD2AP | 22975 | 10173 | -0.001 | -0.3867 | No | ||
| 48 | FYB | 10717 | 10678 | -0.002 | -0.4139 | No | ||
| 49 | MYO18B | 16434 | 10820 | -0.002 | -0.4215 | No | ||
| 50 | DAPK1 | 7632 | 10854 | -0.002 | -0.4232 | No | ||
| 51 | ABLIM2 | 16866 3605 | 10914 | -0.002 | -0.4263 | No | ||
| 52 | FSCN2 | 20569 | 11163 | -0.003 | -0.4396 | No | ||
| 53 | MTSS1 | 5585 22285 | 11237 | -0.003 | -0.4435 | No | ||
| 54 | CLIC5 | 23229 | 12224 | -0.006 | -0.4966 | No | ||
| 55 | GAS2 | 4753 | 12914 | -0.010 | -0.5336 | No | ||
| 56 | AMOT | 11341 24037 6587 | 13359 | -0.013 | -0.5572 | No | ||
| 57 | SPTBN4 | 13471 1104 | 13638 | -0.015 | -0.5719 | No | ||
| 58 | ACTN3 | 23967 8540 | 13818 | -0.017 | -0.5812 | No | ||
| 59 | CDH1 | 18479 | 14069 | -0.020 | -0.5942 | No | ||
| 60 | TNNC1 | 22058 | 14198 | -0.022 | -0.6005 | No | ||
| 61 | MYH7 | 21828 4709 | 14413 | -0.027 | -0.6114 | No | ||
| 62 | TWF1 | 5321 | 14422 | -0.027 | -0.6112 | No | ||
| 63 | MYO6 | 19368 | 15300 | -0.062 | -0.6571 | No | ||
| 64 | GSN | 2784 | 15488 | -0.076 | -0.6654 | No | ||
| 65 | SEPT7 | 10640 | 15677 | -0.094 | -0.6732 | No | ||
| 66 | MYL6 | 9438 3408 | 15997 | -0.147 | -0.6869 | Yes | ||
| 67 | IPP | 16120 | 16005 | -0.148 | -0.6837 | Yes | ||
| 68 | MYO9B | 5142 18581 | 16108 | -0.170 | -0.6852 | Yes | ||
| 69 | CASK | 24184 2618 2604 | 16195 | -0.190 | -0.6852 | Yes | ||
| 70 | DAG1 | 18996 8837 | 16264 | -0.207 | -0.6839 | Yes | ||
| 71 | TNNT2 | 14113 | 16269 | -0.208 | -0.6792 | Yes | ||
| 72 | ARPC3 | 12109 | 16304 | -0.216 | -0.6758 | Yes | ||
| 73 | FLNA | 24129 | 16483 | -0.269 | -0.6789 | Yes | ||
| 74 | IQGAP1 | 6619 | 16674 | -0.333 | -0.6812 | Yes | ||
| 75 | MYO1C | 20777 | 16839 | -0.383 | -0.6808 | Yes | ||
| 76 | CLIC4 | 11386 11342 6620 11387 | 17044 | -0.462 | -0.6807 | Yes | ||
| 77 | CAPG | 17411 | 17107 | -0.491 | -0.6722 | Yes | ||
| 78 | ARPC4 | 12642 | 17260 | -0.554 | -0.6671 | Yes | ||
| 79 | CAPZB | 2529 | 17456 | -0.675 | -0.6614 | Yes | ||
| 80 | CORO1A | 1066 17631 1074 | 17479 | -0.690 | -0.6460 | Yes | ||
| 81 | MYLPF | 18069 | 17492 | -0.698 | -0.6299 | Yes | ||
| 82 | ACTR1A | 23653 | 17500 | -0.703 | -0.6133 | Yes | ||
| 83 | MYL4 | 20632 | 17557 | -0.737 | -0.5986 | Yes | ||
| 84 | SLC9A3R1 | 11250 | 17565 | -0.739 | -0.5812 | Yes | ||
| 85 | ARPC2 | 14225 | 17592 | -0.754 | -0.5645 | Yes | ||
| 86 | WASL | 17203 | 17758 | -0.876 | -0.5523 | Yes | ||
| 87 | WIPF1 | 14560 | 17884 | -0.991 | -0.5352 | Yes | ||
| 88 | WAS | 24193 | 17956 | -1.065 | -0.5134 | Yes | ||
| 89 | LSP1 | 18003 | 17990 | -1.095 | -0.4889 | Yes | ||
| 90 | BMF | 5074 | 18240 | -1.486 | -0.4665 | Yes | ||
| 91 | CDC42EP3 | 6436 | 18293 | -1.634 | -0.4300 | Yes | ||
| 92 | WASF2 | 6326 | 18391 | -1.916 | -0.3892 | Yes | ||
| 93 | TPM4 | 11589 11588 6819 | 18453 | -2.193 | -0.3397 | Yes | ||
| 94 | LASP1 | 4986 4985 1248 | 18543 | -2.904 | -0.2746 | Yes | ||
| 95 | ARPC5 | 12580 7487 | 18557 | -3.122 | -0.2002 | Yes | ||
| 96 | MARCKS | 9331 | 18562 | -3.238 | -0.1225 | Yes | ||
| 97 | MYH9 | 2252 2244 | 18604 | -5.210 | 0.0006 | Yes |

