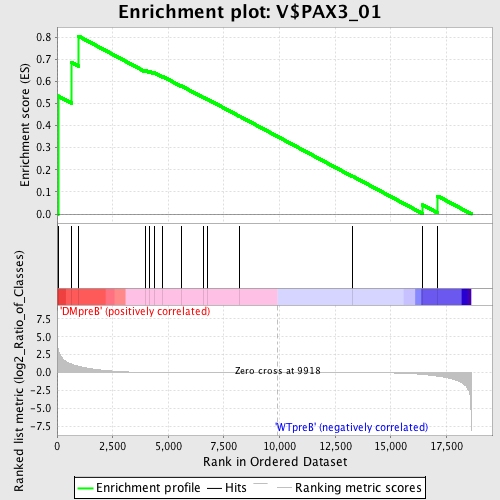
Profile of the Running ES Score & Positions of GeneSet Members on the Rank Ordered List
| Dataset | Set_04_DMpreB_versus_WTpreB.phenotype_DMpreB_versus_WTpreB.cls #DMpreB_versus_WTpreB |
| Phenotype | phenotype_DMpreB_versus_WTpreB.cls#DMpreB_versus_WTpreB |
| Upregulated in class | DMpreB |
| GeneSet | V$PAX3_01 |
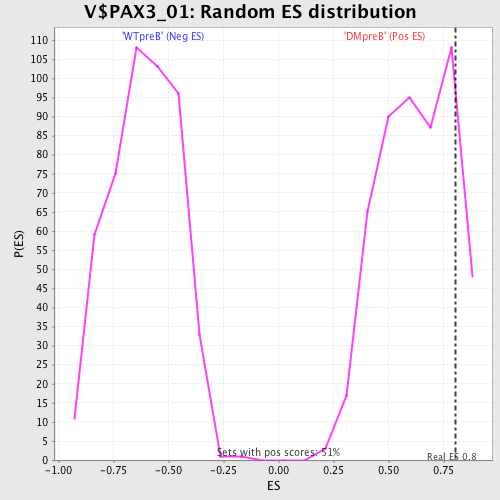
| Enrichment Score (ES) | 0.80414814 |
| Normalized Enrichment Score (NES) | 1.2850163 |
| Nominal p-value | 0.14424951 |
| FDR q-value | 0.6240048 |
| FWER p-Value | 1.0 |
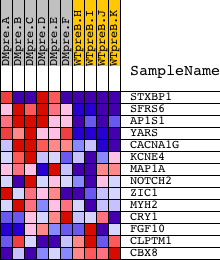
| PROBE | DESCRIPTION (from dataset) | GENE SYMBOL | GENE_TITLE | RANK IN GENE LIST | RANK METRIC SCORE | RUNNING ES | CORE ENRICHMENT | |
|---|---|---|---|---|---|---|---|---|
| 1 | STXBP1 | 2818 9930 | 40 | 3.430 | 0.5336 | Yes | ||
| 2 | SFRS6 | 14751 | 645 | 1.178 | 0.6852 | Yes | ||
| 3 | AP1S1 | 3500 3453 16335 | 960 | 0.870 | 0.8041 | Yes | ||
| 4 | YARS | 16071 | 3976 | 0.041 | 0.6485 | No | ||
| 5 | CACNA1G | 1237 940 20292 | 4168 | 0.036 | 0.6439 | No | ||
| 6 | KCNE4 | 12196 | 4366 | 0.031 | 0.6381 | No | ||
| 7 | MAP1A | 5124 | 4735 | 0.024 | 0.6221 | No | ||
| 8 | NOTCH2 | 15485 | 5582 | 0.015 | 0.5791 | No | ||
| 9 | ZIC1 | 19040 | 6577 | 0.010 | 0.5271 | No | ||
| 10 | MYH2 | 20838 | 6772 | 0.009 | 0.5181 | No | ||
| 11 | CRY1 | 19662 | 8198 | 0.004 | 0.4421 | No | ||
| 12 | FGF10 | 4719 8962 | 13295 | -0.012 | 0.1701 | No | ||
| 13 | CLPTM1 | 17940 | 16431 | -0.253 | 0.0411 | No | ||
| 14 | CBX8 | 11401 | 17102 | -0.489 | 0.0814 | No |