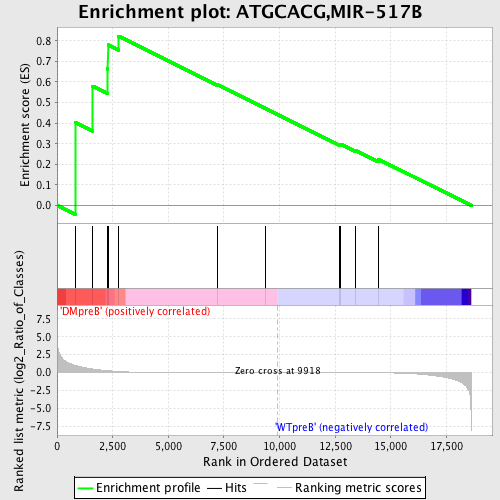
Profile of the Running ES Score & Positions of GeneSet Members on the Rank Ordered List
| Dataset | Set_04_DMpreB_versus_WTpreB.phenotype_DMpreB_versus_WTpreB.cls #DMpreB_versus_WTpreB |
| Phenotype | phenotype_DMpreB_versus_WTpreB.cls#DMpreB_versus_WTpreB |
| Upregulated in class | DMpreB |
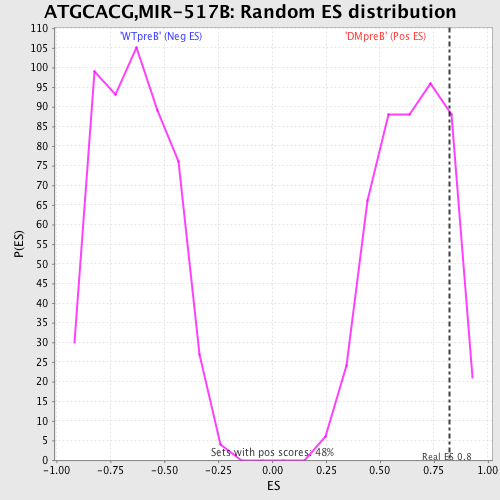
| GeneSet | ATGCACG,MIR-517B |
| Enrichment Score (ES) | 0.82266015 |
| Normalized Enrichment Score (NES) | 1.2829072 |
| Nominal p-value | 0.15513627 |
| FDR q-value | 0.6015964 |
| FWER p-Value | 1.0 |
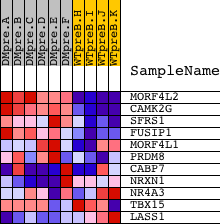
| PROBE | DESCRIPTION (from dataset) | GENE SYMBOL | GENE_TITLE | RANK IN GENE LIST | RANK METRIC SCORE | RUNNING ES | CORE ENRICHMENT | |
|---|---|---|---|---|---|---|---|---|
| 1 | MORF4L2 | 12118 | 813 | 1.012 | 0.4029 | Yes | ||
| 2 | CAMK2G | 21905 | 1605 | 0.498 | 0.5801 | Yes | ||
| 3 | SFRS1 | 8492 | 2269 | 0.270 | 0.6636 | Yes | ||
| 4 | FUSIP1 | 4715 16036 | 2287 | 0.266 | 0.7798 | Yes | ||
| 5 | MORF4L1 | 5723 | 2755 | 0.154 | 0.8227 | Yes | ||
| 6 | PRDM8 | 8084 | 7187 | 0.007 | 0.5877 | No | ||
| 7 | CABP7 | 20542 | 9356 | 0.001 | 0.4718 | No | ||
| 8 | NRXN1 | 1581 1575 22875 | 12680 | -0.009 | 0.2970 | No | ||
| 9 | NR4A3 | 9473 16212 5183 | 12756 | -0.009 | 0.2969 | No | ||
| 10 | TBX15 | 5632 10040 | 13429 | -0.013 | 0.2665 | No | ||
| 11 | LASS1 | 3911 13566 | 14452 | -0.028 | 0.2238 | No |