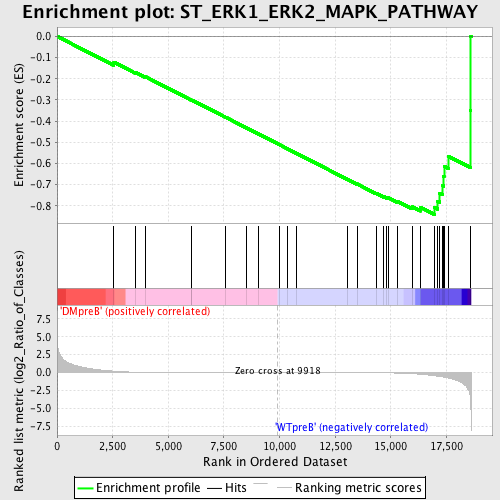
Profile of the Running ES Score & Positions of GeneSet Members on the Rank Ordered List
| Dataset | Set_04_DMpreB_versus_WTpreB.phenotype_DMpreB_versus_WTpreB.cls #DMpreB_versus_WTpreB |
| Phenotype | phenotype_DMpreB_versus_WTpreB.cls#DMpreB_versus_WTpreB |
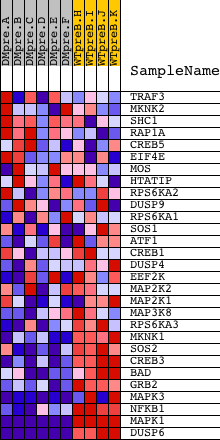
| Upregulated in class | WTpreB |
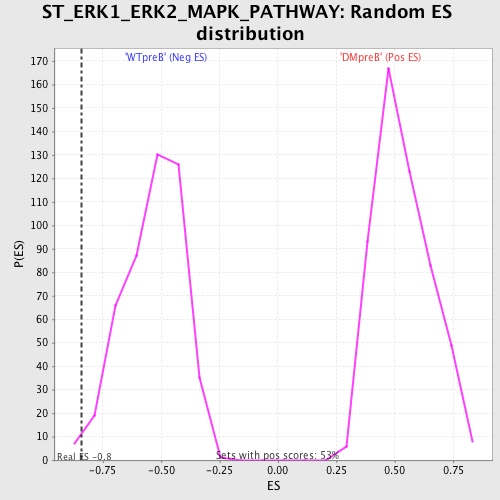
| GeneSet | ST_ERK1_ERK2_MAPK_PATHWAY |
| Enrichment Score (ES) | -0.8407057 |
| Normalized Enrichment Score (NES) | -1.5662584 |
| Nominal p-value | 0.010615711 |
| FDR q-value | 0.077796966 |
| FWER p-Value | 0.49 |
| PROBE | DESCRIPTION (from dataset) | GENE SYMBOL | GENE_TITLE | RANK IN GENE LIST | RANK METRIC SCORE | RUNNING ES | CORE ENRICHMENT | |
|---|---|---|---|---|---|---|---|---|
| 1 | TRAF3 | 21147 | 2551 | 0.200 | -0.1220 | No | ||
| 2 | MKNK2 | 3299 9392 | 3513 | 0.062 | -0.1689 | No | ||
| 3 | SHC1 | 9813 9812 5430 | 3966 | 0.042 | -0.1901 | No | ||
| 4 | RAP1A | 8467 | 6033 | 0.012 | -0.3003 | No | ||
| 5 | CREB5 | 10551 | 6058 | 0.012 | -0.3006 | No | ||
| 6 | EIF4E | 15403 1827 8890 | 7585 | 0.006 | -0.3823 | No | ||
| 7 | MOS | 16254 | 8495 | 0.003 | -0.4309 | No | ||
| 8 | HTATIP | 3690 | 9070 | 0.002 | -0.4617 | No | ||
| 9 | RPS6KA2 | 9759 9758 | 9999 | -0.000 | -0.5116 | No | ||
| 10 | DUSP9 | 24307 | 10373 | -0.001 | -0.5316 | No | ||
| 11 | RPS6KA1 | 15725 | 10766 | -0.002 | -0.5525 | No | ||
| 12 | SOS1 | 5476 | 13043 | -0.010 | -0.6742 | No | ||
| 13 | ATF1 | 8634 4417 | 13480 | -0.013 | -0.6966 | No | ||
| 14 | CREB1 | 3990 8782 4558 4093 | 14348 | -0.026 | -0.7413 | No | ||
| 15 | DUSP4 | 18632 3820 | 14677 | -0.034 | -0.7563 | No | ||
| 16 | EEF2K | 18101 | 14818 | -0.039 | -0.7609 | No | ||
| 17 | MAP2K2 | 19933 | 14885 | -0.041 | -0.7613 | No | ||
| 18 | MAP2K1 | 19082 | 15278 | -0.061 | -0.7778 | No | ||
| 19 | MAP3K8 | 23495 | 15958 | -0.139 | -0.8037 | No | ||
| 20 | RPS6KA3 | 8490 | 16343 | -0.228 | -0.8070 | No | ||
| 21 | MKNK1 | 2504 | 16970 | -0.431 | -0.8079 | Yes | ||
| 22 | SOS2 | 21049 | 17109 | -0.492 | -0.7778 | Yes | ||
| 23 | CREB3 | 16231 | 17200 | -0.526 | -0.7425 | Yes | ||
| 24 | BAD | 24000 | 17315 | -0.582 | -0.7043 | Yes | ||
| 25 | GRB2 | 20149 | 17370 | -0.613 | -0.6605 | Yes | ||
| 26 | MAPK3 | 6458 11170 | 17396 | -0.634 | -0.6135 | Yes | ||
| 27 | NFKB1 | 15160 | 17596 | -0.757 | -0.5665 | Yes | ||
| 28 | MAPK1 | 1642 11167 | 18573 | -3.548 | -0.3485 | Yes | ||
| 29 | DUSP6 | 19891 3399 | 18594 | -4.601 | 0.0012 | Yes |