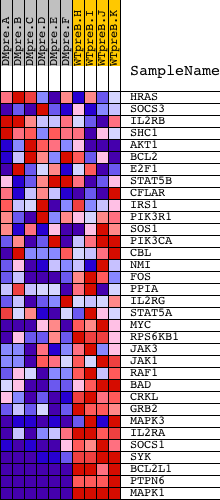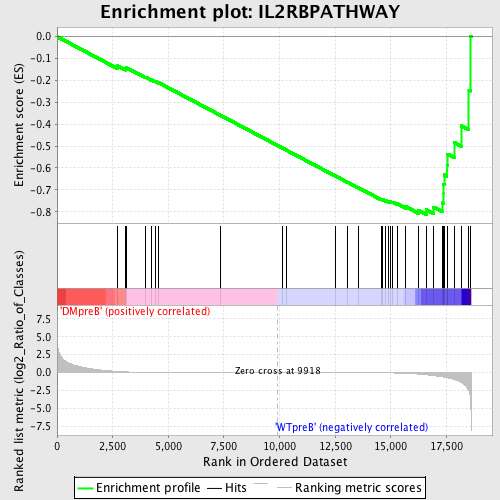
Profile of the Running ES Score & Positions of GeneSet Members on the Rank Ordered List
| Dataset | Set_04_DMpreB_versus_WTpreB.phenotype_DMpreB_versus_WTpreB.cls #DMpreB_versus_WTpreB |
| Phenotype | phenotype_DMpreB_versus_WTpreB.cls#DMpreB_versus_WTpreB |
| Upregulated in class | WTpreB |
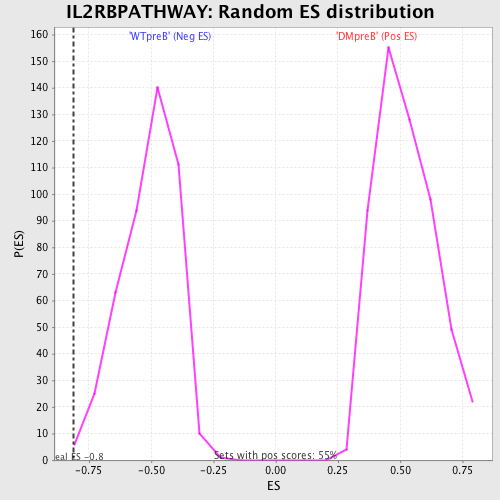
| GeneSet | IL2RBPATHWAY |
| Enrichment Score (ES) | -0.8124671 |
| Normalized Enrichment Score (NES) | -1.596705 |
| Nominal p-value | 0.0044444446 |
| FDR q-value | 0.083057344 |
| FWER p-Value | 0.277 |
| PROBE | DESCRIPTION (from dataset) | GENE SYMBOL | GENE_TITLE | RANK IN GENE LIST | RANK METRIC SCORE | RUNNING ES | CORE ENRICHMENT | |
|---|---|---|---|---|---|---|---|---|
| 1 | HRAS | 4868 | 2695 | 0.167 | -0.1332 | No | ||
| 2 | SOCS3 | 20131 | 3056 | 0.101 | -0.1454 | No | ||
| 3 | IL2RB | 22219 | 3134 | 0.093 | -0.1430 | No | ||
| 4 | SHC1 | 9813 9812 5430 | 3966 | 0.042 | -0.1847 | No | ||
| 5 | AKT1 | 8568 | 4238 | 0.034 | -0.1969 | No | ||
| 6 | BCL2 | 8651 3928 13864 4435 981 4062 13863 4027 | 4399 | 0.030 | -0.2034 | No | ||
| 7 | E2F1 | 14384 | 4578 | 0.027 | -0.2111 | No | ||
| 8 | STAT5B | 20222 | 7328 | 0.007 | -0.3585 | No | ||
| 9 | CFLAR | 8738 4517 | 10118 | -0.000 | -0.5086 | No | ||
| 10 | IRS1 | 4925 | 10289 | -0.001 | -0.5177 | No | ||
| 11 | PIK3R1 | 3170 | 12501 | -0.008 | -0.6361 | No | ||
| 12 | SOS1 | 5476 | 13043 | -0.010 | -0.6645 | No | ||
| 13 | PIK3CA | 9562 | 13536 | -0.014 | -0.6900 | No | ||
| 14 | CBL | 19154 | 14583 | -0.031 | -0.7441 | No | ||
| 15 | NMI | 14590 | 14632 | -0.032 | -0.7444 | No | ||
| 16 | FOS | 21202 | 14780 | -0.038 | -0.7496 | No | ||
| 17 | PPIA | 1284 11188 | 14913 | -0.042 | -0.7538 | No | ||
| 18 | IL2RG | 24096 | 14967 | -0.044 | -0.7535 | No | ||
| 19 | STAT5A | 20664 | 15080 | -0.050 | -0.7560 | No | ||
| 20 | MYC | 22465 9435 | 15293 | -0.062 | -0.7630 | No | ||
| 21 | RPS6KB1 | 7815 1207 13040 | 15680 | -0.094 | -0.7771 | No | ||
| 22 | JAK3 | 9198 4936 | 16236 | -0.199 | -0.7929 | Yes | ||
| 23 | JAK1 | 15827 | 16601 | -0.307 | -0.7908 | Yes | ||
| 24 | RAF1 | 17035 | 16923 | -0.414 | -0.7788 | Yes | ||
| 25 | BAD | 24000 | 17315 | -0.582 | -0.7587 | Yes | ||
| 26 | CRKL | 4560 | 17368 | -0.613 | -0.7182 | Yes | ||
| 27 | GRB2 | 20149 | 17370 | -0.613 | -0.6749 | Yes | ||
| 28 | MAPK3 | 6458 11170 | 17396 | -0.634 | -0.6314 | Yes | ||
| 29 | IL2RA | 4918 | 17525 | -0.716 | -0.5877 | Yes | ||
| 30 | SOCS1 | 4522 | 17563 | -0.738 | -0.5375 | Yes | ||
| 31 | SYK | 21636 | 17870 | -0.978 | -0.4849 | Yes | ||
| 32 | BCL2L1 | 4440 2930 8652 | 18161 | -1.324 | -0.4068 | Yes | ||
| 33 | PTPN6 | 17002 | 18512 | -2.552 | -0.2453 | Yes | ||
| 34 | MAPK1 | 1642 11167 | 18573 | -3.548 | 0.0023 | Yes |