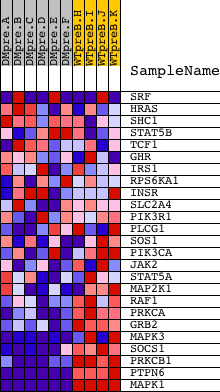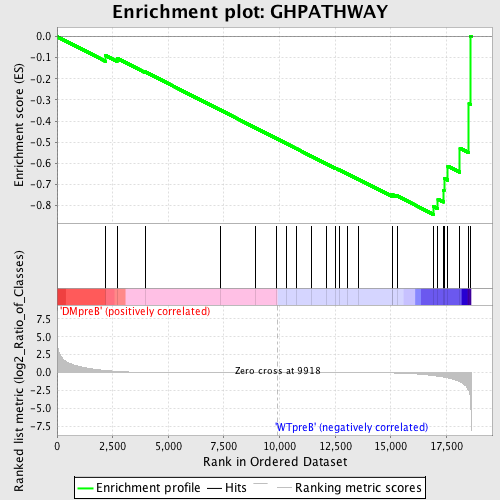
Profile of the Running ES Score & Positions of GeneSet Members on the Rank Ordered List
| Dataset | Set_04_DMpreB_versus_WTpreB.phenotype_DMpreB_versus_WTpreB.cls #DMpreB_versus_WTpreB |
| Phenotype | phenotype_DMpreB_versus_WTpreB.cls#DMpreB_versus_WTpreB |
| Upregulated in class | WTpreB |
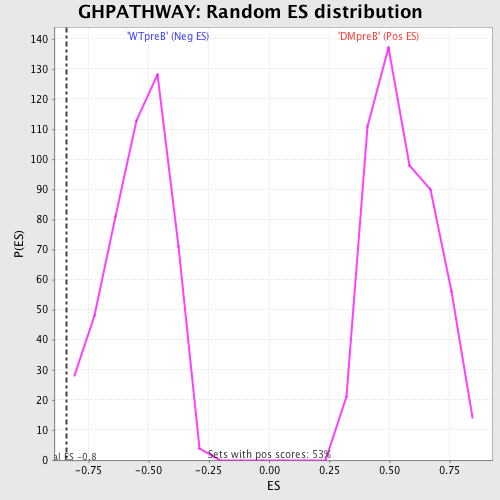
| GeneSet | GHPATHWAY |
| Enrichment Score (ES) | -0.8430093 |
| Normalized Enrichment Score (NES) | -1.5483743 |
| Nominal p-value | 0.0042283298 |
| FDR q-value | 0.08680303 |
| FWER p-Value | 0.616 |
| PROBE | DESCRIPTION (from dataset) | GENE SYMBOL | GENE_TITLE | RANK IN GENE LIST | RANK METRIC SCORE | RUNNING ES | CORE ENRICHMENT | |
|---|---|---|---|---|---|---|---|---|
| 1 | SRF | 22961 1597 | 2181 | 0.296 | -0.0904 | No | ||
| 2 | HRAS | 4868 | 2695 | 0.167 | -0.1027 | No | ||
| 3 | SHC1 | 9813 9812 5430 | 3966 | 0.042 | -0.1672 | No | ||
| 4 | STAT5B | 20222 | 7328 | 0.007 | -0.3474 | No | ||
| 5 | TCF1 | 16416 | 8919 | 0.002 | -0.4327 | No | ||
| 6 | GHR | 22336 | 9880 | 0.000 | -0.4843 | No | ||
| 7 | IRS1 | 4925 | 10289 | -0.001 | -0.5062 | No | ||
| 8 | RPS6KA1 | 15725 | 10766 | -0.002 | -0.5316 | No | ||
| 9 | INSR | 18950 | 11422 | -0.004 | -0.5665 | No | ||
| 10 | SLC2A4 | 20380 | 12102 | -0.006 | -0.6025 | No | ||
| 11 | PIK3R1 | 3170 | 12501 | -0.008 | -0.6232 | No | ||
| 12 | PLCG1 | 14753 | 12673 | -0.009 | -0.6316 | No | ||
| 13 | SOS1 | 5476 | 13043 | -0.010 | -0.6505 | No | ||
| 14 | PIK3CA | 9562 | 13536 | -0.014 | -0.6757 | No | ||
| 15 | JAK2 | 23893 9197 3706 | 15078 | -0.050 | -0.7540 | No | ||
| 16 | STAT5A | 20664 | 15080 | -0.050 | -0.7495 | No | ||
| 17 | MAP2K1 | 19082 | 15278 | -0.061 | -0.7546 | No | ||
| 18 | RAF1 | 17035 | 16923 | -0.414 | -0.8053 | Yes | ||
| 19 | PRKCA | 20174 | 17118 | -0.497 | -0.7705 | Yes | ||
| 20 | GRB2 | 20149 | 17370 | -0.613 | -0.7281 | Yes | ||
| 21 | MAPK3 | 6458 11170 | 17396 | -0.634 | -0.6717 | Yes | ||
| 22 | SOCS1 | 4522 | 17563 | -0.738 | -0.6133 | Yes | ||
| 23 | PRKCB1 | 1693 9574 | 18108 | -1.252 | -0.5286 | Yes | ||
| 24 | PTPN6 | 17002 | 18512 | -2.552 | -0.3177 | Yes | ||
| 25 | MAPK1 | 1642 11167 | 18573 | -3.548 | 0.0023 | Yes |