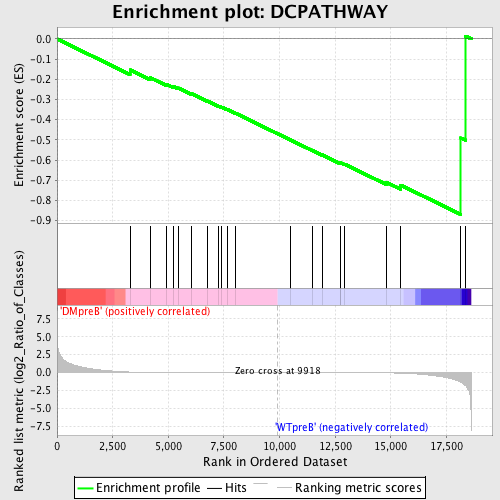
Profile of the Running ES Score & Positions of GeneSet Members on the Rank Ordered List
| Dataset | Set_04_DMpreB_versus_WTpreB.phenotype_DMpreB_versus_WTpreB.cls #DMpreB_versus_WTpreB |
| Phenotype | phenotype_DMpreB_versus_WTpreB.cls#DMpreB_versus_WTpreB |
| Upregulated in class | WTpreB |
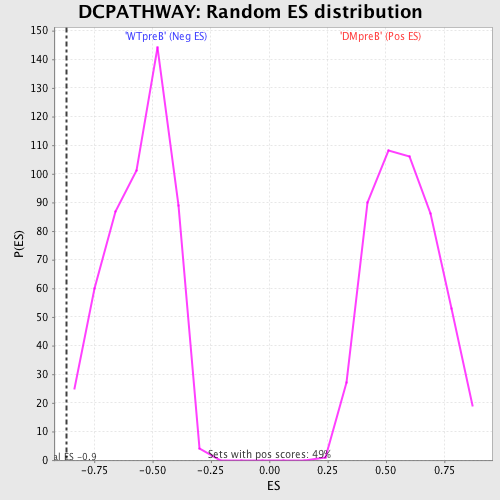
| GeneSet | DCPATHWAY |
| Enrichment Score (ES) | -0.8697292 |
| Normalized Enrichment Score (NES) | -1.5537854 |
| Nominal p-value | 0.0019607844 |
| FDR q-value | 0.08465101 |
| FWER p-Value | 0.577 |
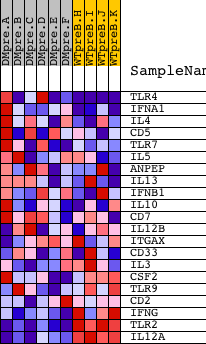
| PROBE | DESCRIPTION (from dataset) | GENE SYMBOL | GENE_TITLE | RANK IN GENE LIST | RANK METRIC SCORE | RUNNING ES | CORE ENRICHMENT | |
|---|---|---|---|---|---|---|---|---|
| 1 | TLR4 | 2329 10191 5770 | 3280 | 0.079 | -0.1535 | No | ||
| 2 | IFNA1 | 9147 | 4178 | 0.036 | -0.1914 | No | ||
| 3 | IL4 | 9174 | 4896 | 0.022 | -0.2235 | No | ||
| 4 | CD5 | 23741 | 5237 | 0.019 | -0.2365 | No | ||
| 5 | TLR7 | 24004 | 5446 | 0.016 | -0.2429 | No | ||
| 6 | IL5 | 20884 10220 | 6024 | 0.012 | -0.2704 | No | ||
| 7 | ANPEP | 17784 | 6758 | 0.009 | -0.3072 | No | ||
| 8 | IL13 | 20461 | 7272 | 0.007 | -0.3328 | No | ||
| 9 | IFNB1 | 15846 | 7391 | 0.006 | -0.3373 | No | ||
| 10 | IL10 | 14145 1510 1553 22902 | 7655 | 0.006 | -0.3498 | No | ||
| 11 | CD7 | 20105 | 8033 | 0.005 | -0.3688 | No | ||
| 12 | IL12B | 20918 | 10475 | -0.001 | -0.4997 | No | ||
| 13 | ITGAX | 18058 | 11470 | -0.004 | -0.5520 | No | ||
| 14 | CD33 | 17851 | 11911 | -0.005 | -0.5741 | No | ||
| 15 | IL3 | 20453 | 12729 | -0.009 | -0.6155 | No | ||
| 16 | CSF2 | 20454 | 12730 | -0.009 | -0.6130 | No | ||
| 17 | TLR9 | 19331 3127 | 12923 | -0.010 | -0.6205 | No | ||
| 18 | CD2 | 15223 | 14809 | -0.038 | -0.7107 | No | ||
| 19 | IFNG | 19869 | 15440 | -0.071 | -0.7241 | Yes | ||
| 20 | TLR2 | 15308 | 18150 | -1.311 | -0.4906 | Yes | ||
| 21 | IL12A | 4913 | 18353 | -1.783 | 0.0141 | Yes |