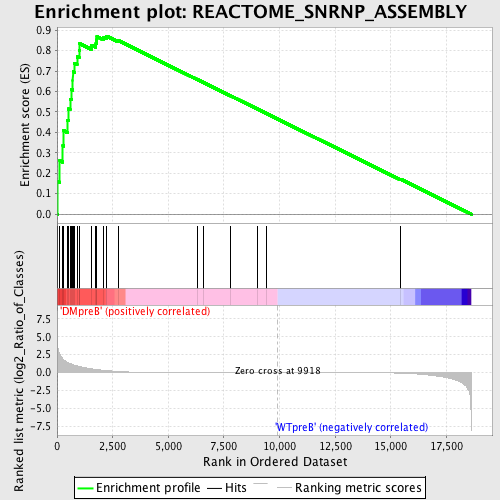
Profile of the Running ES Score & Positions of GeneSet Members on the Rank Ordered List
| Dataset | Set_04_DMpreB_versus_WTpreB.phenotype_DMpreB_versus_WTpreB.cls #DMpreB_versus_WTpreB |
| Phenotype | phenotype_DMpreB_versus_WTpreB.cls#DMpreB_versus_WTpreB |
| Upregulated in class | DMpreB |
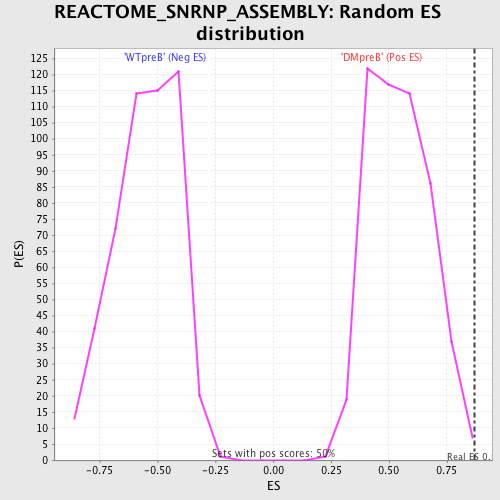
| GeneSet | REACTOME_SNRNP_ASSEMBLY |
| Enrichment Score (ES) | 0.8706481 |
| Normalized Enrichment Score (NES) | 1.5975747 |
| Nominal p-value | 0.0019880715 |
| FDR q-value | 0.02511629 |
| FWER p-Value | 0.312 |
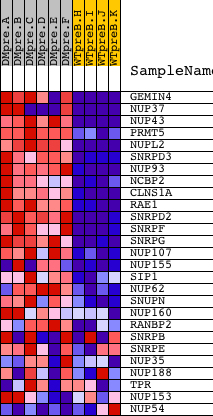
| PROBE | DESCRIPTION (from dataset) | GENE SYMBOL | GENE_TITLE | RANK IN GENE LIST | RANK METRIC SCORE | RUNNING ES | CORE ENRICHMENT | |
|---|---|---|---|---|---|---|---|---|
| 1 | GEMIN4 | 6592 6591 | 31 | 3.857 | 0.1601 | Yes | ||
| 2 | NUP37 | 3294 3326 19909 | 122 | 2.542 | 0.2619 | Yes | ||
| 3 | NUP43 | 20094 | 260 | 1.904 | 0.3343 | Yes | ||
| 4 | PRMT5 | 6571 2817 | 290 | 1.812 | 0.4088 | Yes | ||
| 5 | NUPL2 | 6072 | 468 | 1.423 | 0.4589 | Yes | ||
| 6 | SNRPD3 | 12514 | 506 | 1.373 | 0.5145 | Yes | ||
| 7 | NUP93 | 7762 | 585 | 1.256 | 0.5630 | Yes | ||
| 8 | NCBP2 | 12643 | 646 | 1.178 | 0.6091 | Yes | ||
| 9 | CLNS1A | 4526 4525 | 712 | 1.095 | 0.6516 | Yes | ||
| 10 | RAE1 | 12395 | 714 | 1.094 | 0.6974 | Yes | ||
| 11 | SNRPD2 | 8412 | 784 | 1.029 | 0.7368 | Yes | ||
| 12 | SNRPF | 7645 | 897 | 0.925 | 0.7696 | Yes | ||
| 13 | SNRPG | 12622 | 991 | 0.845 | 0.8000 | Yes | ||
| 14 | NUP107 | 8337 | 1018 | 0.832 | 0.8335 | Yes | ||
| 15 | NUP155 | 2298 5027 | 1548 | 0.525 | 0.8271 | Yes | ||
| 16 | SIP1 | 21263 | 1744 | 0.440 | 0.8350 | Yes | ||
| 17 | NUP62 | 9497 | 1767 | 0.431 | 0.8519 | Yes | ||
| 18 | SNUPN | 12282 | 1789 | 0.424 | 0.8686 | Yes | ||
| 19 | NUP160 | 14957 | 2090 | 0.323 | 0.8660 | Yes | ||
| 20 | RANBP2 | 20019 | 2225 | 0.283 | 0.8706 | Yes | ||
| 21 | SNRPB | 9842 5469 2736 | 2756 | 0.153 | 0.8486 | No | ||
| 22 | SNRPE | 9843 | 6301 | 0.011 | 0.6584 | No | ||
| 23 | NUP35 | 12803 | 6601 | 0.010 | 0.6427 | No | ||
| 24 | NUP188 | 15053 | 7804 | 0.005 | 0.5783 | No | ||
| 25 | TPR | 927 4255 | 8988 | 0.002 | 0.5147 | No | ||
| 26 | NUP153 | 21474 | 9407 | 0.001 | 0.4923 | No | ||
| 27 | NUP54 | 11231 11232 6516 | 15449 | -0.072 | 0.1704 | No |