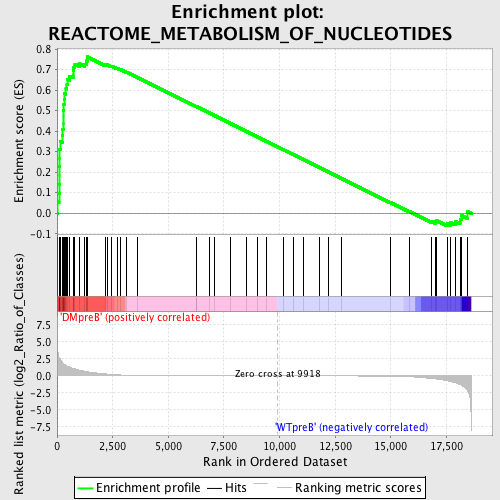
Profile of the Running ES Score & Positions of GeneSet Members on the Rank Ordered List
| Dataset | Set_04_DMpreB_versus_WTpreB.phenotype_DMpreB_versus_WTpreB.cls #DMpreB_versus_WTpreB |
| Phenotype | phenotype_DMpreB_versus_WTpreB.cls#DMpreB_versus_WTpreB |
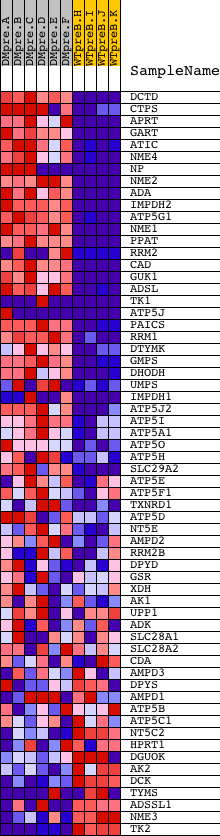
| Upregulated in class | DMpreB |
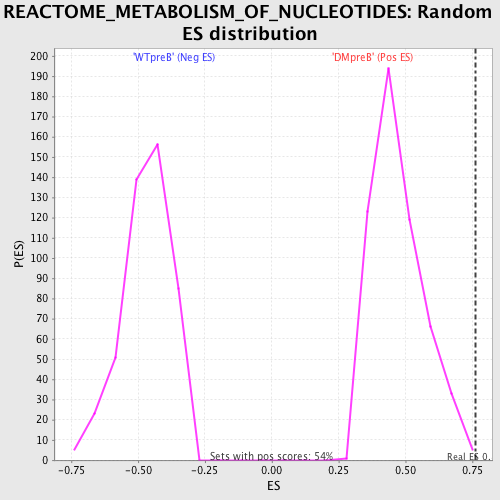
| GeneSet | REACTOME_METABOLISM_OF_NUCLEOTIDES |
| Enrichment Score (ES) | 0.7619509 |
| Normalized Enrichment Score (NES) | 1.6143278 |
| Nominal p-value | 0.0018484289 |
| FDR q-value | 0.024068218 |
| FWER p-Value | 0.214 |
| PROBE | DESCRIPTION (from dataset) | GENE SYMBOL | GENE_TITLE | RANK IN GENE LIST | RANK METRIC SCORE | RUNNING ES | CORE ENRICHMENT | |
|---|---|---|---|---|---|---|---|---|
| 1 | DCTD | 18620 | 38 | 3.458 | 0.0554 | Yes | ||
| 2 | CTPS | 2514 15772 | 86 | 2.716 | 0.0979 | Yes | ||
| 3 | APRT | 8620 | 95 | 2.643 | 0.1414 | Yes | ||
| 4 | GART | 22543 1754 | 107 | 2.575 | 0.1835 | Yes | ||
| 5 | ATIC | 14231 3968 | 108 | 2.568 | 0.2262 | Yes | ||
| 6 | NME4 | 23065 1577 | 120 | 2.545 | 0.2679 | Yes | ||
| 7 | NP | 22027 9597 5273 5274 | 123 | 2.541 | 0.3099 | Yes | ||
| 8 | NME2 | 9468 | 150 | 2.439 | 0.3490 | Yes | ||
| 9 | ADA | 2703 14361 | 236 | 2.017 | 0.3779 | Yes | ||
| 10 | IMPDH2 | 10730 | 254 | 1.927 | 0.4090 | Yes | ||
| 11 | ATP5G1 | 8636 | 270 | 1.873 | 0.4393 | Yes | ||
| 12 | NME1 | 9467 | 273 | 1.870 | 0.4702 | Yes | ||
| 13 | PPAT | 6081 | 274 | 1.868 | 0.5012 | Yes | ||
| 14 | RRM2 | 5401 5400 | 303 | 1.762 | 0.5290 | Yes | ||
| 15 | CAD | 16886 | 321 | 1.716 | 0.5566 | Yes | ||
| 16 | GUK1 | 20432 | 335 | 1.679 | 0.5837 | Yes | ||
| 17 | ADSL | 4358 | 398 | 1.551 | 0.6061 | Yes | ||
| 18 | TK1 | 1457 10182 5762 | 442 | 1.459 | 0.6280 | Yes | ||
| 19 | ATP5J | 880 22555 | 462 | 1.432 | 0.6508 | Yes | ||
| 20 | PAICS | 16820 | 542 | 1.323 | 0.6685 | Yes | ||
| 21 | RRM1 | 18163 | 718 | 1.089 | 0.6772 | Yes | ||
| 22 | DTYMK | 5776 | 720 | 1.087 | 0.6952 | Yes | ||
| 23 | GMPS | 15578 | 748 | 1.059 | 0.7113 | Yes | ||
| 24 | DHODH | 7152 | 801 | 1.020 | 0.7254 | Yes | ||
| 25 | UMPS | 22606 1760 | 1006 | 0.838 | 0.7283 | Yes | ||
| 26 | IMPDH1 | 17197 1131 | 1244 | 0.683 | 0.7269 | Yes | ||
| 27 | ATP5J2 | 12186 | 1324 | 0.629 | 0.7331 | Yes | ||
| 28 | ATP5I | 8637 | 1337 | 0.623 | 0.7428 | Yes | ||
| 29 | ATP5A1 | 23505 | 1360 | 0.613 | 0.7518 | Yes | ||
| 30 | ATP5O | 22539 | 1361 | 0.613 | 0.7620 | Yes | ||
| 31 | ATP5H | 12948 | 2186 | 0.294 | 0.7224 | No | ||
| 32 | SLC29A2 | 23775 | 2254 | 0.275 | 0.7234 | No | ||
| 33 | ATP5E | 14321 | 2451 | 0.224 | 0.7165 | No | ||
| 34 | ATP5F1 | 15212 | 2692 | 0.168 | 0.7064 | No | ||
| 35 | TXNRD1 | 19923 | 2839 | 0.137 | 0.7008 | No | ||
| 36 | ATP5D | 19949 | 3140 | 0.092 | 0.6862 | No | ||
| 37 | NT5E | 19360 18702 | 3615 | 0.057 | 0.6616 | No | ||
| 38 | AMPD2 | 1931 15197 | 6243 | 0.011 | 0.5202 | No | ||
| 39 | RRM2B | 6902 6903 11801 | 6266 | 0.011 | 0.5192 | No | ||
| 40 | DPYD | 15437 | 6866 | 0.008 | 0.4870 | No | ||
| 41 | GSR | 18634 | 7058 | 0.008 | 0.4768 | No | ||
| 42 | XDH | 22897 | 7805 | 0.005 | 0.4367 | No | ||
| 43 | AK1 | 4363 | 8517 | 0.003 | 0.3985 | No | ||
| 44 | UPP1 | 20947 1385 | 9018 | 0.002 | 0.3716 | No | ||
| 45 | ADK | 3302 3454 8555 | 9399 | 0.001 | 0.3511 | No | ||
| 46 | SLC28A1 | 139 | 10178 | -0.001 | 0.3092 | No | ||
| 47 | SLC28A2 | 11246 | 10609 | -0.002 | 0.2860 | No | ||
| 48 | CDA | 15702 | 11081 | -0.003 | 0.2607 | No | ||
| 49 | AMPD3 | 4383 2110 | 11808 | -0.005 | 0.2216 | No | ||
| 50 | DPYS | 22305 | 12213 | -0.006 | 0.2000 | No | ||
| 51 | AMPD1 | 5051 | 12802 | -0.009 | 0.1684 | No | ||
| 52 | ATP5B | 19846 | 14963 | -0.044 | 0.0528 | No | ||
| 53 | ATP5C1 | 8635 | 15830 | -0.118 | 0.0081 | No | ||
| 54 | NT5C2 | 3768 8052 | 16811 | -0.374 | -0.0385 | No | ||
| 55 | HPRT1 | 2655 24339 408 | 17022 | -0.453 | -0.0423 | No | ||
| 56 | DGUOK | 17099 1041 | 17034 | -0.459 | -0.0353 | No | ||
| 57 | AK2 | 8563 2479 16073 | 17531 | -0.720 | -0.0501 | No | ||
| 58 | DCK | 16808 | 17693 | -0.826 | -0.0451 | No | ||
| 59 | TYMS | 5810 5809 3606 3598 | 17913 | -1.023 | -0.0399 | No | ||
| 60 | ADSSL1 | 21136 2087 | 18112 | -1.256 | -0.0297 | No | ||
| 61 | NME3 | 23349 | 18167 | -1.336 | -0.0104 | No | ||
| 62 | TK2 | 18779 | 18433 | -2.082 | 0.0099 | No |