Profile of the Running ES Score & Positions of GeneSet Members on the Rank Ordered List
| Dataset | Set_04_DMpreB_versus_WTpreB.phenotype_DMpreB_versus_WTpreB.cls #DMpreB_versus_WTpreB |
| Phenotype | phenotype_DMpreB_versus_WTpreB.cls#DMpreB_versus_WTpreB |
| Upregulated in class | DMpreB |
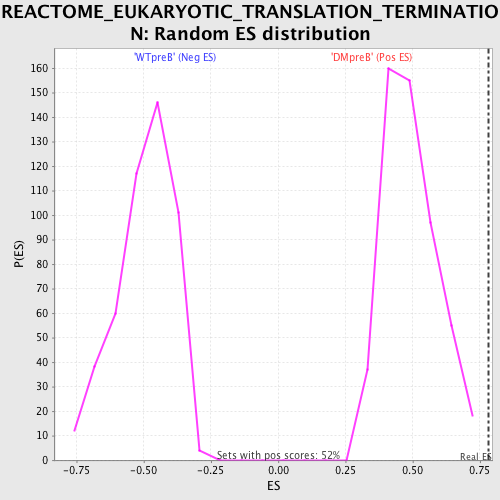
| GeneSet | REACTOME_EUKARYOTIC_TRANSLATION_TERMINATION |
| Enrichment Score (ES) | 0.780948 |
| Normalized Enrichment Score (NES) | 1.5939435 |
| Nominal p-value | 0.0 |
| FDR q-value | 0.023693312 |
| FWER p-Value | 0.331 |
| PROBE | DESCRIPTION (from dataset) | GENE SYMBOL | GENE_TITLE | RANK IN GENE LIST | RANK METRIC SCORE | RUNNING ES | CORE ENRICHMENT | |
|---|---|---|---|---|---|---|---|---|
| 1 | RPL38 | 12562 20606 7475 | 0 | 8.590 | 0.3864 | Yes | ||
| 2 | RPL27A | 11181 6467 18130 | 143 | 2.448 | 0.4888 | Yes | ||
| 3 | ETF1 | 23467 | 565 | 1.296 | 0.5244 | Yes | ||
| 4 | RPL30 | 9742 | 610 | 1.225 | 0.5772 | Yes | ||
| 5 | RPS24 | 5399 | 764 | 1.046 | 0.6160 | Yes | ||
| 6 | RPS2 | 9279 | 1069 | 0.794 | 0.6353 | Yes | ||
| 7 | RPL14 | 19267 | 1073 | 0.792 | 0.6707 | Yes | ||
| 8 | RPL4 | 7499 19411 | 1082 | 0.785 | 0.7056 | Yes | ||
| 9 | RPLP2 | 7401 | 1183 | 0.722 | 0.7327 | Yes | ||
| 10 | RPS19 | 5398 | 1201 | 0.713 | 0.7639 | Yes | ||
| 11 | RPL6 | 9747 | 1385 | 0.599 | 0.7809 | Yes | ||
| 12 | RPS23 | 12352 | 1899 | 0.385 | 0.7707 | No | ||
| 13 | RPS3A | 9755 | 2908 | 0.125 | 0.7220 | No | ||
| 14 | RPS15A | 6476 | 3011 | 0.108 | 0.7214 | No | ||
| 15 | RPS17 | 9753 | 3227 | 0.083 | 0.7136 | No | ||
| 16 | RPS14 | 9751 | 3282 | 0.079 | 0.7142 | No | ||
| 17 | RPS3 | 6549 11295 | 3415 | 0.067 | 0.7101 | No | ||
| 18 | RPL41 | 12611 | 3724 | 0.051 | 0.6958 | No | ||
| 19 | RPL8 | 22437 | 4085 | 0.038 | 0.6782 | No | ||
| 20 | RPL27 | 9740 | 4272 | 0.033 | 0.6696 | No | ||
| 21 | RPL19 | 9736 | 4906 | 0.022 | 0.6365 | No | ||
| 22 | RPL35A | 12194 | 5559 | 0.016 | 0.6021 | No | ||
| 23 | RPS4X | 9756 | 5617 | 0.015 | 0.5997 | No | ||
| 24 | RPL37 | 12502 7421 22521 | 5908 | 0.013 | 0.5847 | No | ||
| 25 | GSPT2 | 4806 | 7481 | 0.006 | 0.5003 | No | ||
| 26 | RPL18 | 450 5390 | 7542 | 0.006 | 0.4974 | No | ||
| 27 | RPL17 | 11429 6653 | 9669 | 0.001 | 0.3829 | No | ||
| 28 | RPSA | 19270 4984 | 10413 | -0.001 | 0.3430 | No | ||
| 29 | RPS13 | 12633 | 11876 | -0.005 | 0.2645 | No | ||
| 30 | RPS16 | 9752 | 14514 | -0.029 | 0.1238 | No | ||
| 31 | RPS5 | 18391 | 14794 | -0.038 | 0.1105 | No | ||
| 32 | RPL5 | 9746 | 14925 | -0.042 | 0.1054 | No | ||
| 33 | FAU | 8954 | 15013 | -0.046 | 0.1028 | No | ||
| 34 | RPS29 | 9754 | 15018 | -0.046 | 0.1046 | No | ||
| 35 | RPL28 | 5392 | 15681 | -0.095 | 0.0732 | No | ||
| 36 | RPL39 | 12496 | 15742 | -0.102 | 0.0746 | No | ||
| 37 | RPS21 | 12356 | 15776 | -0.108 | 0.0777 | No | ||
| 38 | RPLP1 | 3010 | 15793 | -0.111 | 0.0819 | No | ||
| 39 | RPL18A | 13358 | 15800 | -0.112 | 0.0866 | No | ||
| 40 | RPS20 | 7438 | 15905 | -0.129 | 0.0868 | No | ||
| 41 | RPS28 | 12009 | 15921 | -0.130 | 0.0918 | No | ||
| 42 | RPL37A | 9744 | 16068 | -0.161 | 0.0912 | No | ||
| 43 | RPS15 | 5396 | 16272 | -0.209 | 0.0897 | No | ||
| 44 | RPL11 | 12450 | 16276 | -0.209 | 0.0989 | No | ||
| 45 | RPS11 | 11317 | 16502 | -0.276 | 0.0992 | No | ||
| 46 | RPS25 | 13270 | 16642 | -0.323 | 0.1063 | No |