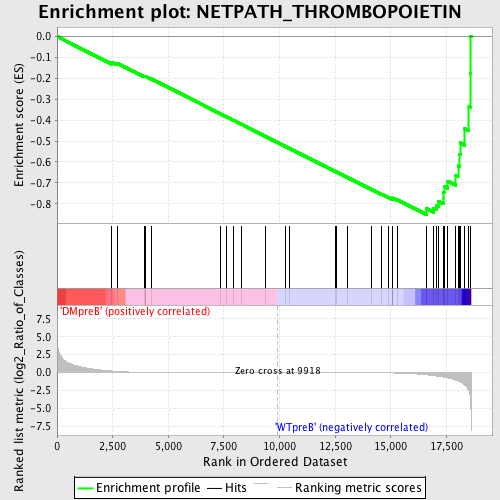
Profile of the Running ES Score & Positions of GeneSet Members on the Rank Ordered List
| Dataset | Set_04_DMpreB_versus_WTpreB.phenotype_DMpreB_versus_WTpreB.cls #DMpreB_versus_WTpreB |
| Phenotype | phenotype_DMpreB_versus_WTpreB.cls#DMpreB_versus_WTpreB |
| Upregulated in class | WTpreB |
| GeneSet | NETPATH_THROMBOPOIETIN |
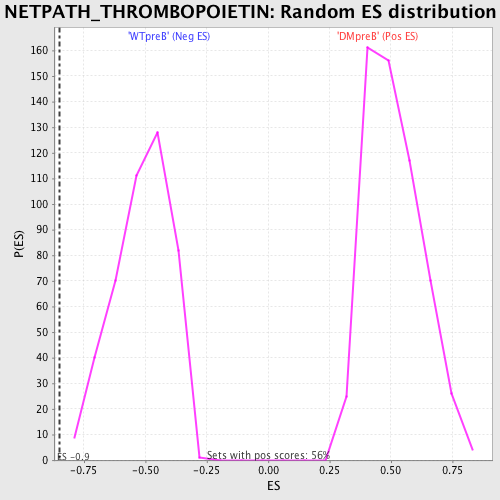
| Enrichment Score (ES) | -0.85113955 |
| Normalized Enrichment Score (NES) | -1.6672277 |
| Nominal p-value | 0.0 |
| FDR q-value | 0.011095031 |
| FWER p-Value | 0.083 |
| PROBE | DESCRIPTION (from dataset) | GENE SYMBOL | GENE_TITLE | RANK IN GENE LIST | RANK METRIC SCORE | RUNNING ES | CORE ENRICHMENT | |
|---|---|---|---|---|---|---|---|---|
| 1 | PRKCZ | 5260 | 2458 | 0.222 | -0.1222 | No | ||
| 2 | HRAS | 4868 | 2695 | 0.167 | -0.1272 | No | ||
| 3 | PIK3R2 | 18850 | 3916 | 0.043 | -0.1910 | No | ||
| 4 | SHC1 | 9813 9812 5430 | 3966 | 0.042 | -0.1917 | No | ||
| 5 | GATA1 | 24196 | 3983 | 0.041 | -0.1907 | No | ||
| 6 | AKT1 | 8568 | 4238 | 0.034 | -0.2028 | No | ||
| 7 | STAT5B | 20222 | 7328 | 0.007 | -0.3688 | No | ||
| 8 | THPO | 22636 | 7611 | 0.006 | -0.3837 | No | ||
| 9 | PRKCE | 9575 | 7917 | 0.005 | -0.3999 | No | ||
| 10 | MPL | 15780 | 8265 | 0.004 | -0.4184 | No | ||
| 11 | PTPN11 | 5326 16391 9660 | 9360 | 0.001 | -0.4772 | No | ||
| 12 | FOXO3 | 19782 3402 | 10282 | -0.001 | -0.5267 | No | ||
| 13 | LYN | 16281 | 10463 | -0.001 | -0.5364 | No | ||
| 14 | PIK3R1 | 3170 | 12501 | -0.008 | -0.6457 | No | ||
| 15 | GAB2 | 1821 18184 2025 | 12547 | -0.008 | -0.6477 | No | ||
| 16 | SOS1 | 5476 | 13043 | -0.010 | -0.6739 | No | ||
| 17 | CRK | 4559 1249 | 14123 | -0.021 | -0.7310 | No | ||
| 18 | CBL | 19154 | 14583 | -0.031 | -0.7543 | No | ||
| 19 | MAP2K2 | 19933 | 14885 | -0.041 | -0.7686 | No | ||
| 20 | POU2F1 | 5275 3989 4065 4010 | 15053 | -0.048 | -0.7754 | No | ||
| 21 | JAK2 | 23893 9197 3706 | 15078 | -0.050 | -0.7744 | No | ||
| 22 | STAT5A | 20664 | 15080 | -0.050 | -0.7722 | No | ||
| 23 | MAP2K1 | 19082 | 15278 | -0.061 | -0.7800 | No | ||
| 24 | ZFPM1 | 18439 | 16600 | -0.306 | -0.8371 | Yes | ||
| 25 | JAK1 | 15827 | 16601 | -0.307 | -0.8231 | Yes | ||
| 26 | RAF1 | 17035 | 16923 | -0.414 | -0.8215 | Yes | ||
| 27 | PRKCD | 21897 | 17066 | -0.470 | -0.8077 | Yes | ||
| 28 | TEC | 16514 | 17142 | -0.506 | -0.7886 | Yes | ||
| 29 | CRKL | 4560 | 17368 | -0.613 | -0.7727 | Yes | ||
| 30 | GRB2 | 20149 | 17370 | -0.613 | -0.7448 | Yes | ||
| 31 | MAPK3 | 6458 11170 | 17396 | -0.634 | -0.7171 | Yes | ||
| 32 | SOCS1 | 4522 | 17563 | -0.738 | -0.6923 | Yes | ||
| 33 | VAV1 | 23173 | 17925 | -1.033 | -0.6646 | Yes | ||
| 34 | IRF2 | 18621 | 18020 | -1.134 | -0.6178 | Yes | ||
| 35 | GAB1 | 18828 | 18101 | -1.234 | -0.5658 | Yes | ||
| 36 | STAT1 | 3936 5524 | 18114 | -1.257 | -0.5090 | Yes | ||
| 37 | STAT3 | 5525 9906 | 18327 | -1.720 | -0.4418 | Yes | ||
| 38 | PTPN6 | 17002 | 18512 | -2.552 | -0.3351 | Yes | ||
| 39 | MAPK1 | 1642 11167 | 18573 | -3.548 | -0.1763 | Yes | ||
| 40 | TP53 | 20822 | 18582 | -3.909 | 0.0018 | Yes |