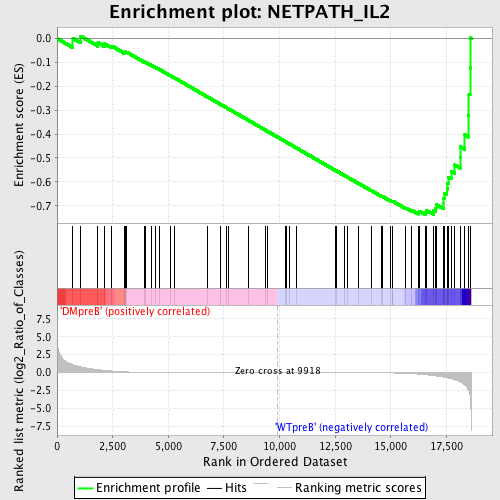
Profile of the Running ES Score & Positions of GeneSet Members on the Rank Ordered List
| Dataset | Set_04_DMpreB_versus_WTpreB.phenotype_DMpreB_versus_WTpreB.cls #DMpreB_versus_WTpreB |
| Phenotype | phenotype_DMpreB_versus_WTpreB.cls#DMpreB_versus_WTpreB |
| Upregulated in class | WTpreB |
| GeneSet | NETPATH_IL2 |
| Enrichment Score (ES) | -0.7365992 |
| Normalized Enrichment Score (NES) | -1.587532 |
| Nominal p-value | 0.0 |
| FDR q-value | 0.048772365 |
| FWER p-Value | 0.521 |
| PROBE | DESCRIPTION (from dataset) | GENE SYMBOL | GENE_TITLE | RANK IN GENE LIST | RANK METRIC SCORE | RUNNING ES | CORE ENRICHMENT | |
|---|---|---|---|---|---|---|---|---|
| 1 | PIK3CB | 19030 | 713 | 1.094 | 0.0005 | No | ||
| 2 | PIK3R3 | 5248 | 1062 | 0.797 | 0.0100 | No | ||
| 3 | ETS2 | 10716 | 1836 | 0.406 | -0.0172 | No | ||
| 4 | GNB2L1 | 20911 | 2121 | 0.312 | -0.0214 | No | ||
| 5 | PRKCZ | 5260 | 2458 | 0.222 | -0.0316 | No | ||
| 6 | STAM2 | 7095 2845 | 3013 | 0.108 | -0.0577 | No | ||
| 7 | SOCS3 | 20131 | 3056 | 0.101 | -0.0563 | No | ||
| 8 | IL2RB | 22219 | 3134 | 0.093 | -0.0572 | No | ||
| 9 | PIK3R2 | 18850 | 3916 | 0.043 | -0.0977 | No | ||
| 10 | SHC1 | 9813 9812 5430 | 3966 | 0.042 | -0.0989 | No | ||
| 11 | AKT1 | 8568 | 4238 | 0.034 | -0.1123 | No | ||
| 12 | BCL2 | 8651 3928 13864 4435 981 4062 13863 4027 | 4399 | 0.030 | -0.1198 | No | ||
| 13 | IL15 | 18826 3801 | 4617 | 0.026 | -0.1306 | No | ||
| 14 | FYN | 3375 3395 20052 | 5080 | 0.020 | -0.1548 | No | ||
| 15 | ETS1 | 10715 6230 3135 | 5256 | 0.018 | -0.1635 | No | ||
| 16 | PLCB1 | 14832 2821 | 6769 | 0.009 | -0.2447 | No | ||
| 17 | STAT5B | 20222 | 7328 | 0.007 | -0.2745 | No | ||
| 18 | FRAP1 | 2468 15991 | 7627 | 0.006 | -0.2904 | No | ||
| 19 | SHB | 10493 | 7716 | 0.005 | -0.2950 | No | ||
| 20 | IL2 | 15354 | 8581 | 0.003 | -0.3414 | No | ||
| 21 | PTPN11 | 5326 16391 9660 | 9360 | 0.001 | -0.3833 | No | ||
| 22 | ITM2B | 9192 4935 21753 | 9449 | 0.001 | -0.3880 | No | ||
| 23 | FOXO3 | 19782 3402 | 10282 | -0.001 | -0.4328 | No | ||
| 24 | IRS1 | 4925 | 10289 | -0.001 | -0.4331 | No | ||
| 25 | LYN | 16281 | 10463 | -0.001 | -0.4424 | No | ||
| 26 | INSL3 | 9181 | 10755 | -0.002 | -0.4580 | No | ||
| 27 | PIK3R1 | 3170 | 12501 | -0.008 | -0.5517 | No | ||
| 28 | GAB2 | 1821 18184 2025 | 12547 | -0.008 | -0.5539 | No | ||
| 29 | NGFR | 5174 | 12926 | -0.010 | -0.5739 | No | ||
| 30 | SOS1 | 5476 | 13043 | -0.010 | -0.5798 | No | ||
| 31 | PIK3CA | 9562 | 13536 | -0.014 | -0.6058 | No | ||
| 32 | CRK | 4559 1249 | 14123 | -0.021 | -0.6366 | No | ||
| 33 | CBL | 19154 | 14583 | -0.031 | -0.6603 | No | ||
| 34 | NMI | 14590 | 14632 | -0.032 | -0.6617 | No | ||
| 35 | IL2RG | 24096 | 14967 | -0.044 | -0.6781 | No | ||
| 36 | JAK2 | 23893 9197 3706 | 15078 | -0.050 | -0.6823 | No | ||
| 37 | STAT5A | 20664 | 15080 | -0.050 | -0.6806 | No | ||
| 38 | RPS6KB1 | 7815 1207 13040 | 15680 | -0.094 | -0.7095 | No | ||
| 39 | NR3C1 | 9043 | 15930 | -0.131 | -0.7182 | No | ||
| 40 | JAK3 | 9198 4936 | 16236 | -0.199 | -0.7276 | Yes | ||
| 41 | LCK | 15746 | 16281 | -0.210 | -0.7225 | Yes | ||
| 42 | STAM | 2912 15117 | 16544 | -0.289 | -0.7263 | Yes | ||
| 43 | JAK1 | 15827 | 16601 | -0.307 | -0.7184 | Yes | ||
| 44 | RAF1 | 17035 | 16923 | -0.414 | -0.7210 | Yes | ||
| 45 | CISH | 8743 | 17015 | -0.450 | -0.7100 | Yes | ||
| 46 | ICAM1 | 19545 | 17031 | -0.458 | -0.6945 | Yes | ||
| 47 | CRKL | 4560 | 17368 | -0.613 | -0.6908 | Yes | ||
| 48 | GRB2 | 20149 | 17370 | -0.613 | -0.6691 | Yes | ||
| 49 | MAPK3 | 6458 11170 | 17396 | -0.634 | -0.6479 | Yes | ||
| 50 | IL2RA | 4918 | 17525 | -0.716 | -0.6293 | Yes | ||
| 51 | SOCS1 | 4522 | 17563 | -0.738 | -0.6051 | Yes | ||
| 52 | NFKB1 | 15160 | 17596 | -0.757 | -0.5799 | Yes | ||
| 53 | RELA | 23783 | 17734 | -0.859 | -0.5567 | Yes | ||
| 54 | SYK | 21636 | 17870 | -0.978 | -0.5292 | Yes | ||
| 55 | STAT1 | 3936 5524 | 18114 | -1.257 | -0.4976 | Yes | ||
| 56 | PTK2B | 21776 | 18118 | -1.260 | -0.4530 | Yes | ||
| 57 | STAT3 | 5525 9906 | 18327 | -1.720 | -0.4031 | Yes | ||
| 58 | CD53 | 4500 | 18501 | -2.502 | -0.3235 | Yes | ||
| 59 | PTPN6 | 17002 | 18512 | -2.552 | -0.2333 | Yes | ||
| 60 | PIK3CG | 6635 | 18560 | -3.168 | -0.1232 | Yes | ||
| 61 | MAPK1 | 1642 11167 | 18573 | -3.548 | 0.0023 | Yes |

