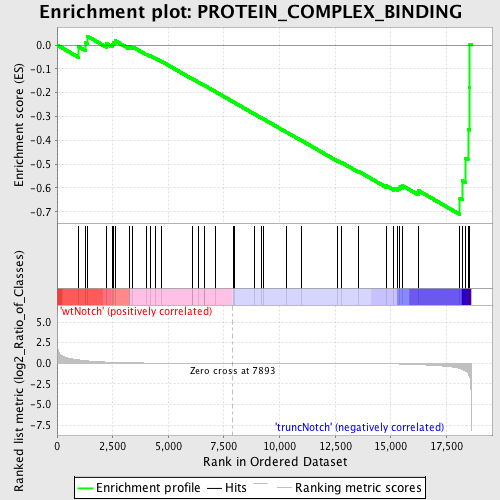
Profile of the Running ES Score & Positions of GeneSet Members on the Rank Ordered List
| Dataset | Set_03_wtNotch_versus_truncNotch.phenotype_wtNotch_versus_truncNotch.cls #wtNotch_versus_truncNotch.phenotype_wtNotch_versus_truncNotch.cls #wtNotch_versus_truncNotch_repos |
| Phenotype | phenotype_wtNotch_versus_truncNotch.cls#wtNotch_versus_truncNotch_repos |
| Upregulated in class | truncNotch |
| GeneSet | PROTEIN_COMPLEX_BINDING |
| Enrichment Score (ES) | -0.7111634 |
| Normalized Enrichment Score (NES) | -1.5211147 |
| Nominal p-value | 0.01831502 |
| FDR q-value | 0.67020476 |
| FWER p-Value | 1.0 |
| PROBE | DESCRIPTION (from dataset) | GENE SYMBOL | GENE_TITLE | RANK IN GENE LIST | RANK METRIC SCORE | RUNNING ES | CORE ENRICHMENT | |
|---|---|---|---|---|---|---|---|---|
| 1 | PCNA | 940754 | 954 | 0.414 | -0.0066 | No | ||
| 2 | MLH1 | 6450168 | 1284 | 0.314 | 0.0096 | No | ||
| 3 | ATR | 6860273 | 1357 | 0.292 | 0.0373 | No | ||
| 4 | DOCK2 | 2940040 | 2216 | 0.136 | 0.0058 | No | ||
| 5 | ERBB2IP | 580253 1090672 | 2480 | 0.108 | 0.0033 | No | ||
| 6 | PMS2 | 6760739 | 2541 | 0.102 | 0.0111 | No | ||
| 7 | ADAM9 | 3360411 | 2609 | 0.096 | 0.0180 | No | ||
| 8 | SHC1 | 2900731 3170504 6520537 | 3240 | 0.053 | -0.0102 | No | ||
| 9 | ADAM11 | 1050008 3130494 | 3259 | 0.052 | -0.0056 | No | ||
| 10 | THY1 | 5910162 | 3404 | 0.046 | -0.0084 | No | ||
| 11 | PEX6 | 2100253 6660162 | 4007 | 0.026 | -0.0380 | No | ||
| 12 | INSL3 | 4150092 | 4196 | 0.023 | -0.0456 | No | ||
| 13 | TNXB | 630592 3830020 5360497 7000673 | 4440 | 0.019 | -0.0567 | No | ||
| 14 | ADAMTS8 | 3990497 | 4712 | 0.015 | -0.0696 | No | ||
| 15 | ANGPTL3 | 6180497 | 6083 | 0.006 | -0.1427 | No | ||
| 16 | ADAM23 | 460091 2450156 | 6086 | 0.006 | -0.1422 | No | ||
| 17 | VWF | 4670519 | 6368 | 0.005 | -0.1568 | No | ||
| 18 | COL4A3 | 5910075 | 6607 | 0.004 | -0.1692 | No | ||
| 19 | ADAM2 | 670121 | 6616 | 0.004 | -0.1692 | No | ||
| 20 | IRS1 | 1190204 | 7098 | 0.002 | -0.1948 | No | ||
| 21 | CAV3 | 1770519 | 7944 | -0.000 | -0.2403 | No | ||
| 22 | ADAMTS5 | 5890592 | 7971 | -0.000 | -0.2417 | No | ||
| 23 | DMP1 | 4760398 | 8892 | -0.003 | -0.2909 | No | ||
| 24 | PIK3R1 | 4730671 | 9200 | -0.004 | -0.3070 | No | ||
| 25 | EGFL6 | 3940181 | 9263 | -0.004 | -0.3100 | No | ||
| 26 | SYK | 6940133 | 10308 | -0.007 | -0.3654 | No | ||
| 27 | EDIL3 | 1240039 | 10968 | -0.010 | -0.3998 | No | ||
| 28 | FBLN5 | 6550010 | 12599 | -0.021 | -0.4853 | No | ||
| 29 | DST | 430026 1090035 2340577 3170068 3870112 4780519 6400167 6450358 7040347 | 12802 | -0.023 | -0.4937 | No | ||
| 30 | TREX1 | 3450040 7100692 | 13559 | -0.033 | -0.5309 | No | ||
| 31 | ECM2 | 1470561 | 14802 | -0.064 | -0.5908 | No | ||
| 32 | ACTN3 | 3140541 6480598 | 15137 | -0.078 | -0.6004 | No | ||
| 33 | ICAM4 | 6770053 | 15315 | -0.088 | -0.6004 | No | ||
| 34 | ICAM2 | 6400113 | 15411 | -0.094 | -0.5954 | No | ||
| 35 | MSH2 | 6180273 | 15539 | -0.102 | -0.5912 | No | ||
| 36 | COL16A1 | 1780520 | 16247 | -0.168 | -0.6111 | No | ||
| 37 | MUTYH | 1780441 5700121 | 18106 | -0.625 | -0.6436 | Yes | ||
| 38 | ACTN4 | 3840301 4590390 7050132 | 18217 | -0.733 | -0.5702 | Yes | ||
| 39 | TGFBI | 2060446 6900112 | 18366 | -0.957 | -0.4747 | Yes | ||
| 40 | ERCC8 | 1240300 6450372 6590180 | 18471 | -1.176 | -0.3530 | Yes | ||
| 41 | MSH6 | 4480064 6520093 | 18545 | -1.653 | -0.1783 | Yes | ||
| 42 | ACTN2 | 4200435 | 18553 | -1.683 | 0.0034 | Yes |

